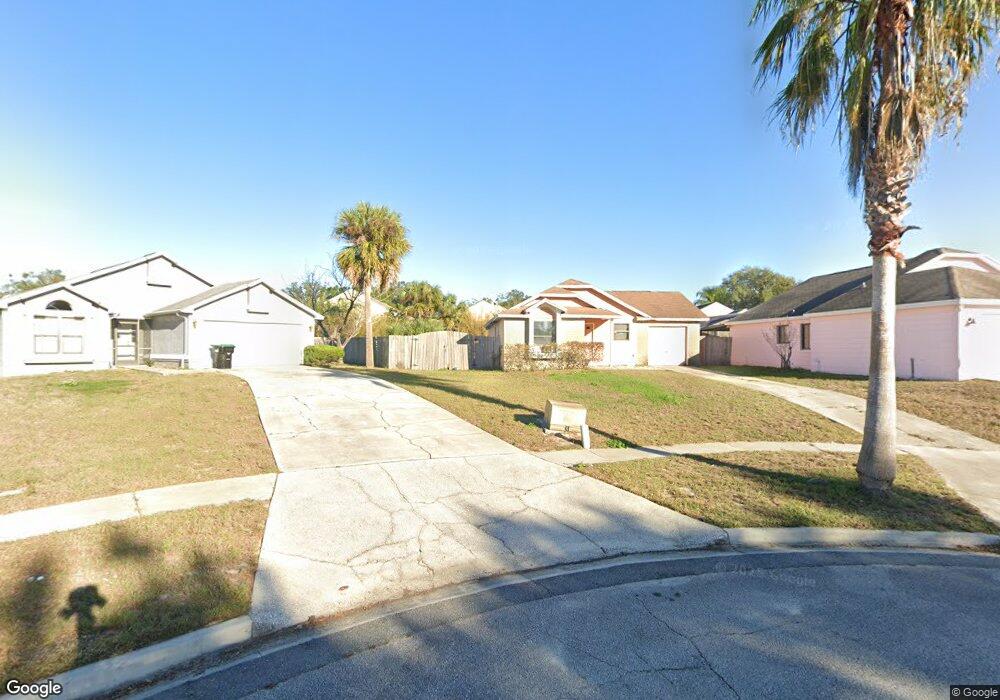
163 Cooper Ct Orlando, FL 32835
MetroWest NeighborhoodEstimated Value: $248,000 - $283,000
2
Beds
1
Bath
968
Sq Ft
$267/Sq Ft
Est. Value
About This Home
This home is located at 163 Cooper Ct, Orlando, FL 32835 and is currently estimated at $258,524, approximately $267 per square foot. 163 Cooper Ct is a home located in Orange County with nearby schools including Oak Hill Elementary, Gotha Middle School, and Olympia High.
Ownership History
Date
Name
Owned For
Owner Type
Purchase Details
Closed on
Sep 11, 2009
Sold by
Hastings Julie A
Bought by
Harsha Michael L
Current Estimated Value
Purchase Details
Closed on
Jan 31, 2005
Sold by
Molnar Kimberly A and Molnar Robert
Bought by
Harsha Michael L and Hastings Julie A
Home Financials for this Owner
Home Financials are based on the most recent Mortgage that was taken out on this home.
Original Mortgage
$86,400
Interest Rate
6.44%
Mortgage Type
Purchase Money Mortgage
Purchase Details
Closed on
Sep 10, 2004
Sold by
Johnson Anderson Jason and Johnson Vanessa
Bought by
Molnar Kimberly A
Purchase Details
Closed on
Mar 25, 2002
Sold by
David Williams I
Bought by
Johnson Anderson
Home Financials for this Owner
Home Financials are based on the most recent Mortgage that was taken out on this home.
Original Mortgage
$61,600
Interest Rate
6.86%
Mortgage Type
New Conventional
Create a Home Valuation Report for This Property
The Home Valuation Report is an in-depth analysis detailing your home's value as well as a comparison with similar homes in the area
Home Values in the Area
Average Home Value in this Area
Purchase History
| Date | Buyer | Sale Price | Title Company |
|---|---|---|---|
| Harsha Michael L | $42,070 | None Available | |
| Harsha Michael L | $108,000 | -- | |
| Molnar Kimberly A | $85,000 | -- | |
| Johnson Anderson | $77,000 | -- |
Source: Public Records
Mortgage History
| Date | Status | Borrower | Loan Amount |
|---|---|---|---|
| Previous Owner | Harsha Michael L | $86,400 | |
| Previous Owner | Johnson Anderson | $61,600 | |
| Closed | Harsha Michael L | $21,600 |
Source: Public Records
Tax History Compared to Growth
Tax History
| Year | Tax Paid | Tax Assessment Tax Assessment Total Assessment is a certain percentage of the fair market value that is determined by local assessors to be the total taxable value of land and additions on the property. | Land | Improvement |
|---|---|---|---|---|
| 2025 | $3,083 | $157,645 | -- | -- |
| 2024 | $2,789 | $157,645 | -- | -- |
| 2023 | $2,789 | $187,022 | $65,000 | $122,022 |
| 2022 | $2,503 | $163,520 | $62,500 | $101,020 |
| 2021 | $2,196 | $126,865 | $45,900 | $80,965 |
| 2020 | $2,044 | $127,526 | $45,900 | $81,626 |
| 2019 | $2,071 | $128,188 | $45,900 | $82,288 |
| 2018 | $1,871 | $108,280 | $39,000 | $69,280 |
| 2017 | $1,715 | $95,784 | $35,000 | $60,784 |
| 2016 | $1,595 | $86,620 | $30,000 | $56,620 |
| 2015 | $1,509 | $78,566 | $25,000 | $53,566 |
| 2014 | $1,557 | $84,156 | $25,000 | $59,156 |
Source: Public Records
Map
Nearby Homes
- 326 N Lancelot Ave
- 325 N Hart Blvd
- 329 N Hart Blvd
- 431 N Hiawassee Rd
- 6227 Melbourne Ave
- 0 S Buena Vista Ave Unit MFRO6351745
- 20 Winter Ridge Cir
- 330 S Lancelot Ave
- 338 S Hart Blvd
- 230 Lucile Way
- 7266 Oak Meadows Cir
- 7003 Harbor Point Blvd
- 7237 Harbor Heights Cir
- 302 Lucile Way
- 307 S Hiawassee Rd
- 415 S Lancelot Ave
- 341 Alston Dr
- 252 Alston Dr Unit II
- 7319 Seamans Bluff
- 450 S Buena Vista Ave
- 161 Cooper Ct
- 167 Cooper Ct
- 157 Cooper Ct
- 169 Cooper Ct
- 138 Grand Junction Blvd
- 136 Grand Junction Blvd
- 140 Grand Junction Blvd
- 132 Grand Junction Blvd
- 155 Cooper Ct
- 144 Grand Junction Blvd
- 128 Grand Junction Blvd
- 170 Cooper Ct
- 146 Grand Junction Blvd
- 164 Cooper Ct
- 162 Cooper Ct
- 151 Cooper Ct
- 126 Grand Junction Blvd
- 168 Cooper Ct
- 158 Cooper Ct
- 6550 Chantry St