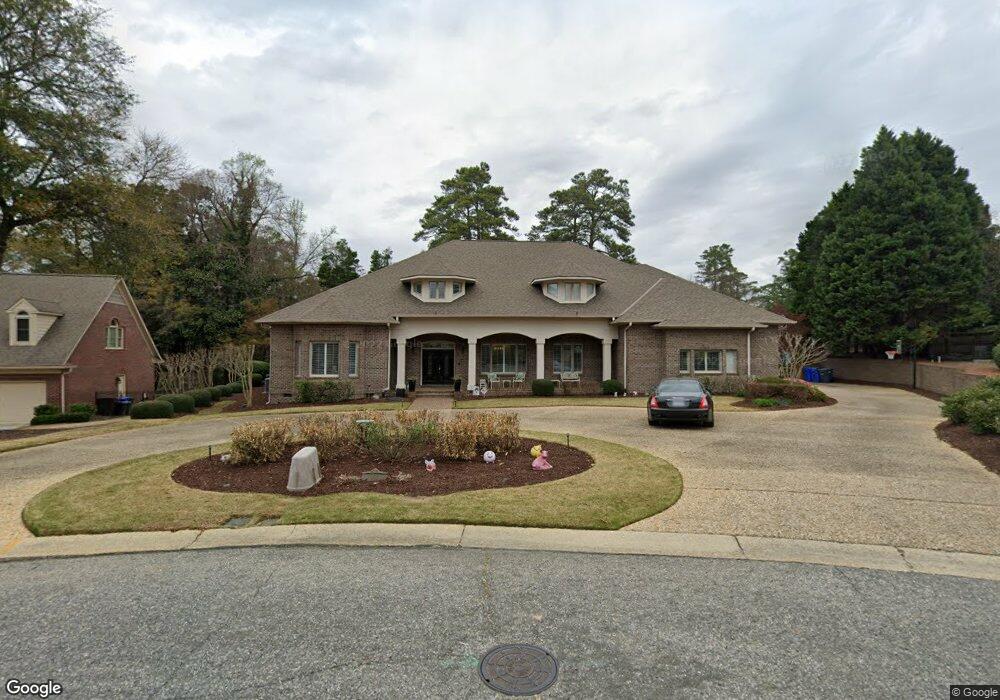
163 S Churchill Dr Fayetteville, NC 28303
Terry Sanford NeighborhoodEstimated Value: $821,000 - $1,062,000
4
Beds
6
Baths
6,026
Sq Ft
$162/Sq Ft
Est. Value
About This Home
This home is located at 163 S Churchill Dr, Fayetteville, NC 28303 and is currently estimated at $974,595, approximately $161 per square foot. 163 S Churchill Dr is a home located in Cumberland County with nearby schools including Alma O Easom Elementary, Vanstory Hills Elementary School, and R. Max Abbott Middle School.
Ownership History
Date
Name
Owned For
Owner Type
Purchase Details
Closed on
Jan 11, 2022
Sold by
Aul and Janene
Bought by
Klenzak Scott M and Kouba Jessica L
Current Estimated Value
Home Financials for this Owner
Home Financials are based on the most recent Mortgage that was taken out on this home.
Original Mortgage
$647,200
Outstanding Balance
$596,006
Interest Rate
3.05%
Mortgage Type
New Conventional
Estimated Equity
$378,589
Purchase Details
Closed on
Aug 12, 2020
Sold by
Richard L Fox L and Richard Ashton L
Bought by
Patti Mit B and Patti Kena
Purchase Details
Closed on
Jun 2, 2009
Sold by
Allison D Keith
Bought by
Aul Ryan
Home Financials for this Owner
Home Financials are based on the most recent Mortgage that was taken out on this home.
Original Mortgage
$412,000
Interest Rate
4.8%
Mortgage Type
New Conventional
Create a Home Valuation Report for This Property
The Home Valuation Report is an in-depth analysis detailing your home's value as well as a comparison with similar homes in the area
Home Values in the Area
Average Home Value in this Area
Purchase History
| Date | Buyer | Sale Price | Title Company |
|---|---|---|---|
| Klenzak Scott M | $915,000 | Jennifer Kirby Fincher Pllc | |
| Patti Mit B | $99,000 | None Available | |
| Aul Ryan | $750,000 | -- |
Source: Public Records
Mortgage History
| Date | Status | Borrower | Loan Amount |
|---|---|---|---|
| Open | Klenzak Scott M | $647,200 | |
| Previous Owner | Aul Ryan | $412,000 |
Source: Public Records
Tax History Compared to Growth
Tax History
| Year | Tax Paid | Tax Assessment Tax Assessment Total Assessment is a certain percentage of the fair market value that is determined by local assessors to be the total taxable value of land and additions on the property. | Land | Improvement |
|---|---|---|---|---|
| 2024 | $9,232 | $877,681 | $150,000 | $727,681 |
| 2023 | $10,183 | $877,681 | $150,000 | $727,681 |
| 2022 | $9,484 | $877,681 | $150,000 | $727,681 |
| 2021 | $9,484 | $877,681 | $150,000 | $727,681 |
| 2019 | $9,449 | $703,200 | $150,000 | $553,200 |
| 2018 | $9,449 | $703,200 | $150,000 | $553,200 |
| 2017 | $9,346 | $703,200 | $150,000 | $553,200 |
| 2016 | $11,121 | $886,200 | $150,000 | $736,200 |
| 2015 | $11,002 | $886,200 | $150,000 | $736,200 |
| 2014 | $10,995 | $886,200 | $150,000 | $736,200 |
Source: Public Records
Map
Nearby Homes
- 159 S Churchill Dr
- 2305 Westdale Dr
- 2301 Westdale Dr
- 150 S Churchill Dr
- 2315 Westdale Dr
- 155 S Churchill Dr
- 175 S Churchill Dr
- 210 Blueridge Rd
- 156 S Churchill Dr
- 2217 Westdale Dr
- 164 S Churchill Dr
- 168 S Churchill Dr
- 2306 Gunston Ct
- 151 S Churchill Dr
- 208 Blueridge Rd
- 2215 Westdale Dr
- 2319 Westdale Dr
- 206 Blueridge Rd
- 2300 Westdale Dr