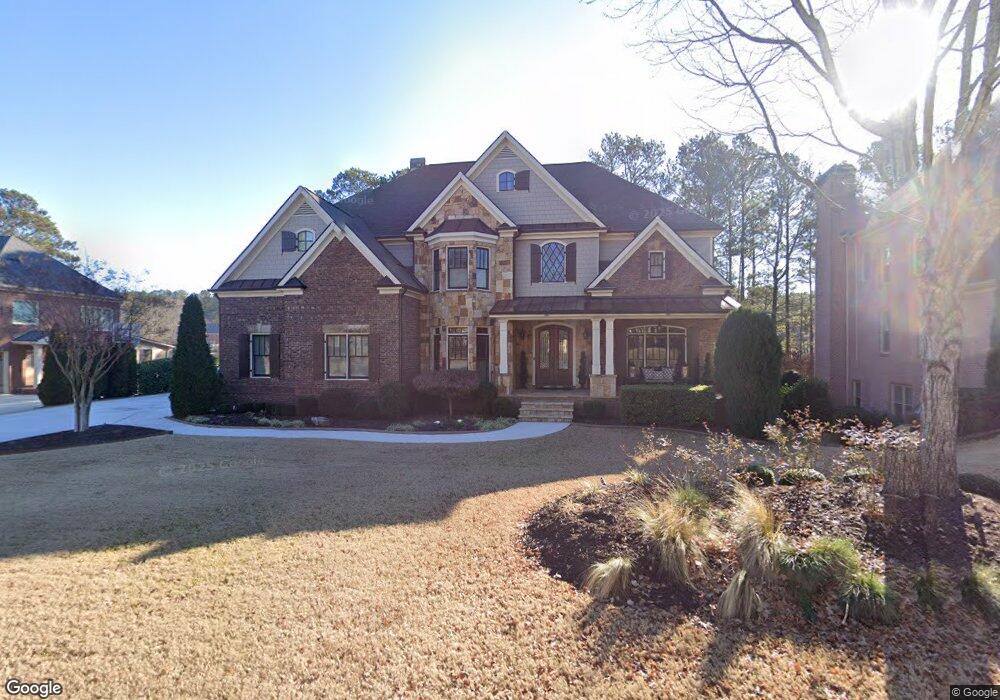
1639 Fernstone Dr NW Acworth, GA 30101
Estimated Value: $904,000 - $1,437,000
5
Beds
6
Baths
4,659
Sq Ft
$241/Sq Ft
Est. Value
About This Home
This home is located at 1639 Fernstone Dr NW, Acworth, GA 30101 and is currently estimated at $1,123,128, approximately $241 per square foot. 1639 Fernstone Dr NW is a home located in Cobb County with nearby schools including Ford Elementary School, Durham Middle School, and Harrison High School.
Ownership History
Date
Name
Owned For
Owner Type
Purchase Details
Closed on
Jun 30, 2009
Sold by
Chapline Homes Llc
Bought by
Goode Weston R and Goode Paige E
Current Estimated Value
Home Financials for this Owner
Home Financials are based on the most recent Mortgage that was taken out on this home.
Original Mortgage
$417,000
Outstanding Balance
$263,750
Interest Rate
4.79%
Mortgage Type
New Conventional
Estimated Equity
$859,378
Purchase Details
Closed on
Apr 18, 2008
Sold by
James Richard Properties Inc
Bought by
Chapline Homes Llc
Home Financials for this Owner
Home Financials are based on the most recent Mortgage that was taken out on this home.
Original Mortgage
$532,500
Interest Rate
5.86%
Purchase Details
Closed on
Jan 30, 2007
Sold by
Willoughby & Sewell Dev Ltd
Bought by
James Richard Props Inc
Home Financials for this Owner
Home Financials are based on the most recent Mortgage that was taken out on this home.
Original Mortgage
$487,400
Interest Rate
6.14%
Create a Home Valuation Report for This Property
The Home Valuation Report is an in-depth analysis detailing your home's value as well as a comparison with similar homes in the area
Home Values in the Area
Average Home Value in this Area
Purchase History
| Date | Buyer | Sale Price | Title Company |
|---|---|---|---|
| Goode Weston R | $629,000 | -- | |
| Chapline Homes Llc | $163,000 | -- | |
| James Richard Props Inc | $125,000 | -- |
Source: Public Records
Mortgage History
| Date | Status | Borrower | Loan Amount |
|---|---|---|---|
| Open | Goode Weston R | $417,000 | |
| Previous Owner | Chapline Homes Llc | $532,500 | |
| Previous Owner | James Richard Props Inc | $487,400 |
Source: Public Records
Tax History Compared to Growth
Tax History
| Year | Tax Paid | Tax Assessment Tax Assessment Total Assessment is a certain percentage of the fair market value that is determined by local assessors to be the total taxable value of land and additions on the property. | Land | Improvement |
|---|---|---|---|---|
| 2025 | $3,548 | $391,288 | $60,000 | $331,288 |
| 2024 | $3,498 | $372,048 | $54,000 | $318,048 |
| 2023 | $3,292 | $372,048 | $54,000 | $318,048 |
| 2022 | $3,258 | $291,964 | $50,000 | $241,964 |
| 2021 | $8,861 | $291,964 | $50,000 | $241,964 |
| 2020 | $8,861 | $291,964 | $50,000 | $241,964 |
| 2019 | $7,356 | $242,376 | $50,000 | $192,376 |
| 2018 | $7,356 | $242,376 | $50,000 | $192,376 |
| 2017 | $6,198 | $215,588 | $50,000 | $165,588 |
| 2016 | $6,198 | $215,588 | $50,000 | $165,588 |
| 2015 | $6,299 | $213,824 | $60,000 | $153,824 |
| 2014 | $6,353 | $213,824 | $0 | $0 |
Source: Public Records
Map
Nearby Homes
- 1391 Benbrooke Ln NW
- 1382 Benbrooke Ln NW
- 5881 Brookstone Walk NW
- 94 Brookstone Ct
- 97 Brookstone Ct
- 001 Amber Glow Ln NW
- 160 Brookstone Park E
- 1707 Kenbrook Ct NW
- 5830 Brookstone Walk NW
- 5894 Amber Glow Ln
- 002 Knob Creek Ct NW
- 1670 Knob Creek Ct NW
- 63 Brookstone Park E
- 1945 Seymour Dr NW
- 6065 Victoria Falls Overlook NW
- The Brooks Plan at Woodford
- The Pinehurst Plan at Woodford
- The Vinings Plan at Woodford
- The Evans Plan at Woodford
- The Rebecca Plan at Woodford
- 1641 Fernstone Dr NW
- 1637 Fernstone Dr NW
- 1643 Fernstone Dr NW
- 1642 Fernstone Dr NW
- 0 Fernstone Dr NW Unit 8716994
- 0 Fernstone Dr NW Unit 9001682
- 0 Fernstone Dr NW Unit 8772235
- 0 Fernstone Dr NW Unit 8855620
- 0 Fernstone Dr NW Unit 3181435
- 0 Fernstone Dr NW Unit 3218830
- 0 Fernstone Dr NW Unit 7373545
- 0 Fernstone Dr NW Unit 7523542
- 0 Fernstone Dr NW Unit 7601849
- 0 Fernstone Dr NW Unit 8141385
- 0 Fernstone Dr NW Unit 8178850
- 0 Fernstone Dr NW Unit 8194027
- 0 Fernstone Dr NW Unit 8281394
- 0 Fernstone Dr NW Unit 8335394
- 0 Fernstone Dr NW Unit 8376437
- 6200 Fernstone Pointe NW