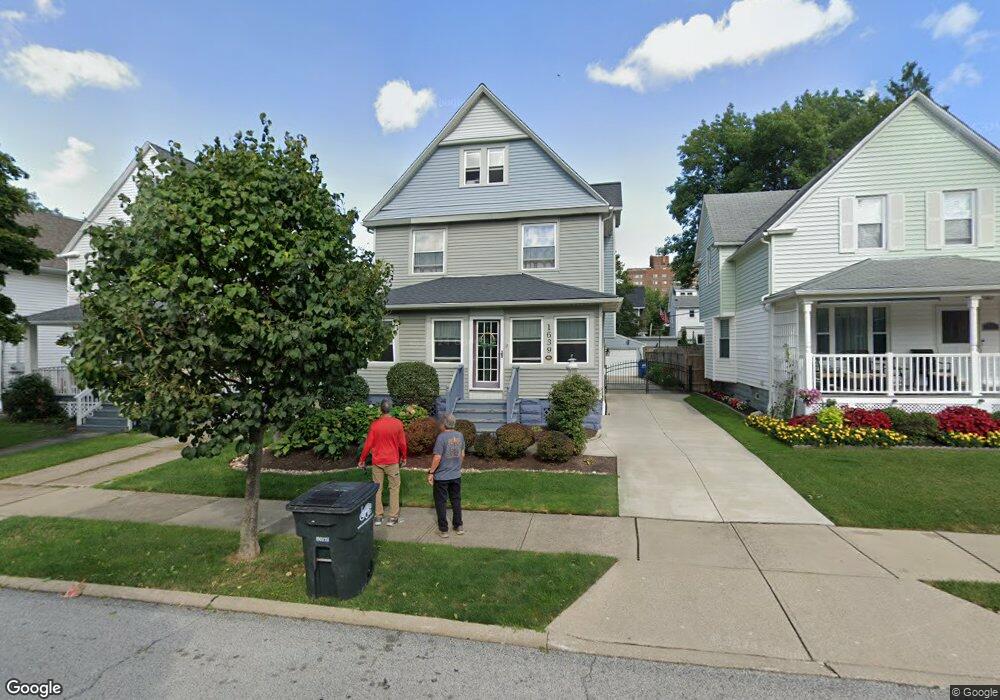
1639 Rosewood Ave Lakewood, OH 44107
Estimated Value: $334,009 - $406,000
3
Beds
1
Bath
1,493
Sq Ft
$254/Sq Ft
Est. Value
About This Home
This home is located at 1639 Rosewood Ave, Lakewood, OH 44107 and is currently estimated at $379,752, approximately $254 per square foot. 1639 Rosewood Ave is a home located in Cuyahoga County with nearby schools including Grant Elementary School, Harding Middle School, and Lakewood High School.
Ownership History
Date
Name
Owned For
Owner Type
Purchase Details
Closed on
May 16, 2003
Sold by
Ellis Kathleen R and Ellis Thomas C
Bought by
Palumbo Nicole M
Current Estimated Value
Home Financials for this Owner
Home Financials are based on the most recent Mortgage that was taken out on this home.
Original Mortgage
$118,655
Outstanding Balance
$46,215
Interest Rate
4.37%
Mortgage Type
Purchase Money Mortgage
Estimated Equity
$333,537
Purchase Details
Closed on
Jan 6, 1987
Bought by
Ellis Kathleen R
Purchase Details
Closed on
Jul 22, 1985
Sold by
Crawford Thomas H
Bought by
National City Bank
Purchase Details
Closed on
Sep 13, 1978
Sold by
Baughman Robert E
Bought by
Crawford Thomas H
Purchase Details
Closed on
Sep 3, 1976
Sold by
Baughman Robert E and G M
Bought by
Baughman Robert E
Purchase Details
Closed on
Jan 1, 1975
Bought by
Baughman Robert E and G M
Create a Home Valuation Report for This Property
The Home Valuation Report is an in-depth analysis detailing your home's value as well as a comparison with similar homes in the area
Home Values in the Area
Average Home Value in this Area
Purchase History
| Date | Buyer | Sale Price | Title Company |
|---|---|---|---|
| Palumbo Nicole M | $124,900 | -- | |
| Ellis Kathleen R | $38,500 | -- | |
| National City Bank | -- | -- | |
| Crawford Thomas H | $49,900 | -- | |
| Baughman Robert E | -- | -- | |
| Baughman Robert E | -- | -- |
Source: Public Records
Mortgage History
| Date | Status | Borrower | Loan Amount |
|---|---|---|---|
| Open | Palumbo Nicole M | $118,655 |
Source: Public Records
Tax History Compared to Growth
Tax History
| Year | Tax Paid | Tax Assessment Tax Assessment Total Assessment is a certain percentage of the fair market value that is determined by local assessors to be the total taxable value of land and additions on the property. | Land | Improvement |
|---|---|---|---|---|
| 2024 | $5,692 | $88,620 | $19,355 | $69,265 |
| 2023 | $5,223 | $69,590 | $14,810 | $54,780 |
| 2022 | $5,256 | $69,580 | $14,805 | $54,775 |
| 2021 | $5,203 | $69,580 | $14,810 | $54,780 |
| 2020 | $4,613 | $53,940 | $11,480 | $42,460 |
| 2019 | $4,522 | $154,100 | $32,800 | $121,300 |
| 2018 | $4,515 | $53,940 | $11,480 | $42,460 |
| 2017 | $3,977 | $43,160 | $8,860 | $34,300 |
| 2016 | $3,950 | $43,160 | $8,860 | $34,300 |
| 2015 | $3,954 | $43,160 | $8,860 | $34,300 |
| 2014 | $3,954 | $41,520 | $8,510 | $33,010 |
Source: Public Records
Map
Nearby Homes
- 1617 Westwood Ave
- 15555 Hilliard Rd Unit 401A
- 1547 Orchard Grove Ave
- 1542 Westwood Ave
- 1615 Wagar Ave
- 1578 Mars Ave
- 1563 Wagar Ave
- 1507 Orchard Grove Ave
- 1450 Orchard Grove Ave
- 1594 Victoria Ave
- 2209 Woodward Ave
- 1500 Lauderdale Ave
- 1431 Northland Ave
- 1437 Woodward Ave
- 2239 Woodward Ave
- 2165 Arthur Ave
- 2234 Olive Ave
- 14924 Arden Ave
- 17322 Archdale Ave
- 2223 Eldred Ave
- 1635 Rosewood Ave
- 1643 Rosewood Ave
- 1631 Rosewood Ave
- 1647 Rosewood Ave
- 1640 Westwood Ave
- 1634 Westwood Ave
- 1627 Rosewood Ave
- 1646 Westwood Ave
- 1653 Rosewood Ave
- 1630 Westwood Ave
- 15894 Park Place
- 1628 Westwood Ave
- 1626 Westwood Ave
- 1623 Rosewood Ave
- 1638 Rosewood Ave
- 1652 Westwood Ave
- 1634 Rosewood Ave
- 1630 Rosewood Ave
- 1622 Westwood Ave
- 15898 Park Place