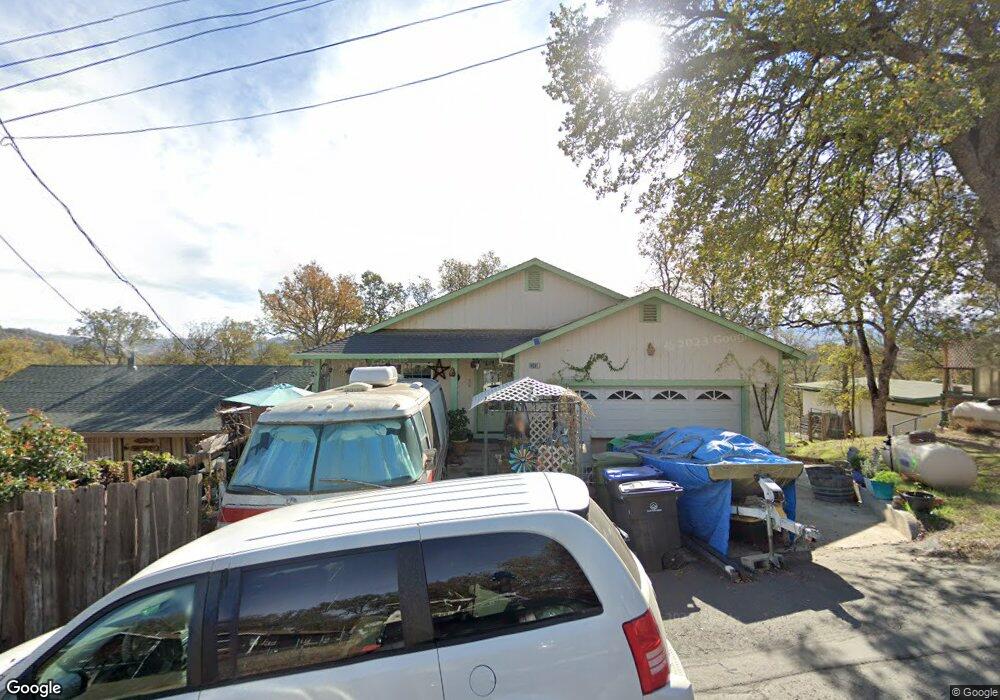
16391 32nd Ave Clearlake, CA 95422
Estimated Value: $357,828 - $486,000
4
Beds
3
Baths
2,381
Sq Ft
$179/Sq Ft
Est. Value
About This Home
This home is located at 16391 32nd Ave, Clearlake, CA 95422 and is currently estimated at $426,207, approximately $179 per square foot. 16391 32nd Ave is a home located in Lake County with nearby schools including Lower Lake High School, Jeannies Learning Garden, and Clearlake Seventh-day Adventist Christian School.
Ownership History
Date
Name
Owned For
Owner Type
Purchase Details
Closed on
Aug 11, 2023
Sold by
Stoner Suzanna
Bought by
Vonstein Graeson K and Rife Ronald Maurice
Current Estimated Value
Purchase Details
Closed on
May 21, 2015
Sold by
Vonstein Graeson K and Stoner Brian K
Bought by
Stoner Suzanna
Purchase Details
Closed on
Nov 25, 2014
Sold by
Stoner Suzanna
Bought by
Stoner Suzanna and Vonstein Graeson K
Purchase Details
Closed on
May 13, 2010
Sold by
Bank Of America National Association
Bought by
Stoner Warner Lee and Stoner Linda L
Home Financials for this Owner
Home Financials are based on the most recent Mortgage that was taken out on this home.
Original Mortgage
$135,179
Interest Rate
4.99%
Mortgage Type
FHA
Purchase Details
Closed on
Aug 6, 2009
Sold by
Lopes Aurelio B
Bought by
Bank Of America National Association
Create a Home Valuation Report for This Property
The Home Valuation Report is an in-depth analysis detailing your home's value as well as a comparison with similar homes in the area
Home Values in the Area
Average Home Value in this Area
Purchase History
| Date | Buyer | Sale Price | Title Company |
|---|---|---|---|
| Vonstein Graeson K | -- | None Listed On Document | |
| Stoner Suzanna | -- | None Available | |
| Stoner Suzanna | -- | None Available | |
| Stoner Warner Lee | $137,000 | Chicago Title Company | |
| Bank Of America National Association | $160,650 | None Available |
Source: Public Records
Mortgage History
| Date | Status | Borrower | Loan Amount |
|---|---|---|---|
| Previous Owner | Stoner Warner Lee | $135,179 |
Source: Public Records
Tax History Compared to Growth
Tax History
| Year | Tax Paid | Tax Assessment Tax Assessment Total Assessment is a certain percentage of the fair market value that is determined by local assessors to be the total taxable value of land and additions on the property. | Land | Improvement |
|---|---|---|---|---|
| 2025 | $3,512 | $306,000 | $15,300 | $290,700 |
| 2024 | $3,471 | $300,000 | $15,000 | $285,000 |
| 2023 | $2,066 | $167,331 | $16,598 | $150,733 |
| 2022 | $1,962 | $164,051 | $16,273 | $147,778 |
| 2021 | $2,011 | $160,835 | $15,954 | $144,881 |
| 2020 | $2,559 | $159,187 | $15,791 | $143,396 |
| 2019 | $2,463 | $156,067 | $15,482 | $140,585 |
| 2018 | $2,180 | $153,008 | $15,179 | $137,829 |
| 2017 | $1,826 | $150,009 | $14,882 | $135,127 |
| 2016 | $1,689 | $147,069 | $14,591 | $132,478 |
| 2015 | $1,684 | $147,137 | $17,182 | $129,955 |
| 2014 | -- | $144,256 | $16,846 | $127,410 |
Source: Public Records
Map
Nearby Homes
- 16463 33rd Ave
- 16374 35th Ave Unit 2
- 16223 31st Ave
- 16272 27th Ave
- 16333 27th Ave
- 16238 35th Ave
- 16175 29th Ave
- 16165 29th Ave
- 16115 33rd Ave
- 16182 27th Ave
- 16258 35th Ave
- 16108 36th Ave
- 16115 27th Ave
- 16218 24th Ave
- 16122 27th Ave
- 16152 27th Ave
- 16008 34th Ave
- 15530 31st Ave
- 16336 22nd Ave
- 15608 36th Ave