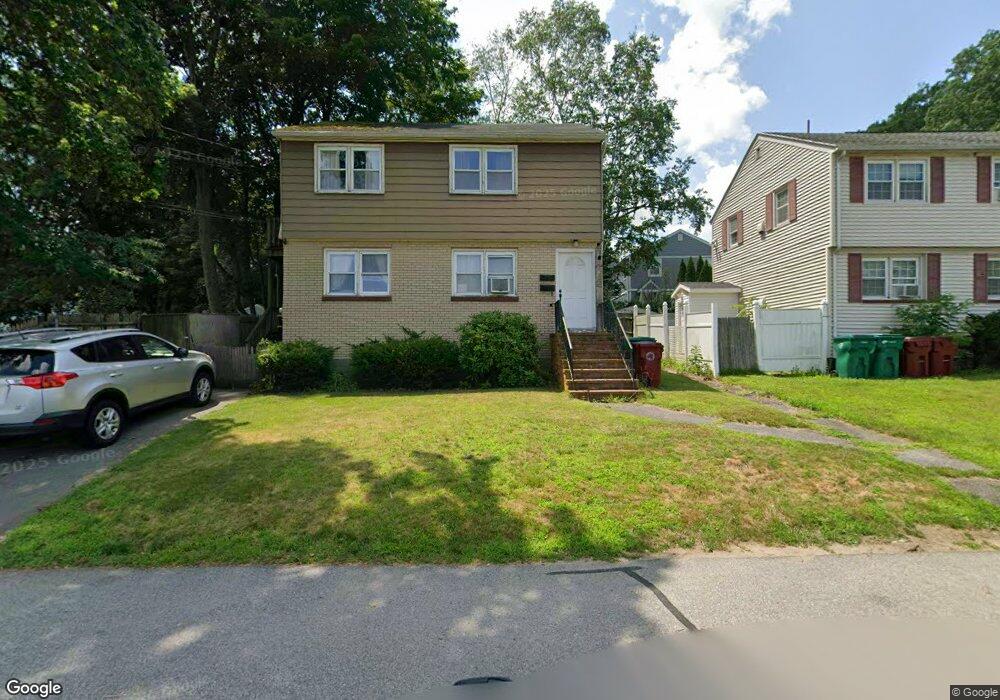
164 Llewellyn St Lowell, MA 01850
Centralville NeighborhoodEstimated Value: $408,000 - $540,000
3
Beds
2
Baths
1,323
Sq Ft
$344/Sq Ft
Est. Value
About This Home
This home is located at 164 Llewellyn St, Lowell, MA 01850 and is currently estimated at $455,626, approximately $344 per square foot. 164 Llewellyn St is a home located in Middlesex County with nearby schools including S. Christa McAuliffe Elementary School, Greenhalge Elementary School, and Moody Elementary School.
Ownership History
Date
Name
Owned For
Owner Type
Purchase Details
Closed on
Jan 18, 2002
Sold by
Szopa Nancy
Bought by
Szopa Laurie
Current Estimated Value
Home Financials for this Owner
Home Financials are based on the most recent Mortgage that was taken out on this home.
Original Mortgage
$93,584
Outstanding Balance
$37,698
Interest Rate
6.84%
Mortgage Type
Purchase Money Mortgage
Estimated Equity
$417,928
Purchase Details
Closed on
Nov 25, 1994
Sold by
Szopa Daniel
Bought by
Szopa Nancy and Szopa Laurie
Create a Home Valuation Report for This Property
The Home Valuation Report is an in-depth analysis detailing your home's value as well as a comparison with similar homes in the area
Home Values in the Area
Average Home Value in this Area
Purchase History
| Date | Buyer | Sale Price | Title Company |
|---|---|---|---|
| Szopa Laurie | $68,000 | -- | |
| Szopa Laurie | $68,000 | -- | |
| Szopa Nancy | $80,000 | -- | |
| Szopa Nancy | $80,000 | -- |
Source: Public Records
Mortgage History
| Date | Status | Borrower | Loan Amount |
|---|---|---|---|
| Open | Szopa Nancy | $93,584 | |
| Closed | Szopa Nancy | $93,584 |
Source: Public Records
Tax History Compared to Growth
Tax History
| Year | Tax Paid | Tax Assessment Tax Assessment Total Assessment is a certain percentage of the fair market value that is determined by local assessors to be the total taxable value of land and additions on the property. | Land | Improvement |
|---|---|---|---|---|
| 2025 | $4,536 | $395,100 | $125,700 | $269,400 |
| 2024 | $4,240 | $356,000 | $117,500 | $238,500 |
| 2023 | $3,935 | $316,800 | $102,200 | $214,600 |
| 2022 | $3,645 | $287,200 | $92,900 | $194,300 |
| 2021 | $3,381 | $251,200 | $80,800 | $170,400 |
| 2020 | $3,043 | $227,800 | $70,600 | $157,200 |
| 2019 | $3,020 | $215,100 | $65,400 | $149,700 |
| 2018 | $2,828 | $196,500 | $62,300 | $134,200 |
| 2017 | $2,674 | $179,200 | $56,600 | $122,600 |
| 2016 | $2,808 | $185,200 | $55,200 | $130,000 |
| 2015 | $2,613 | $168,800 | $55,200 | $113,600 |
| 2013 | $2,399 | $159,800 | $64,500 | $95,300 |
Source: Public Records
Map
Nearby Homes