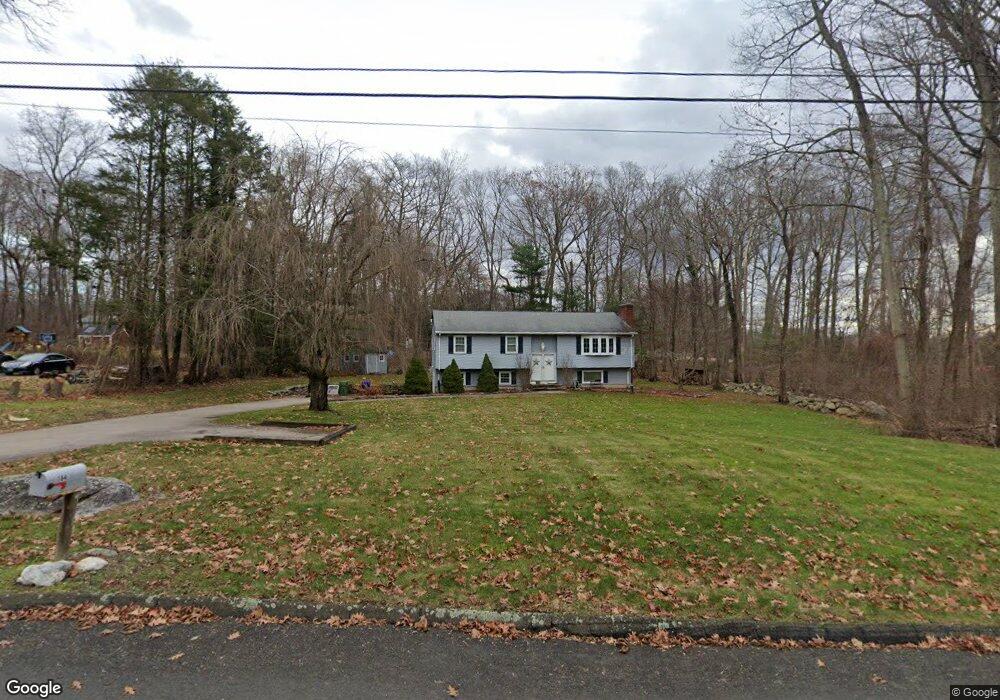
164 Mott Hill Rd East Hampton, CT 06424
Estimated Value: $344,000 - $388,000
3
Beds
2
Baths
1,236
Sq Ft
$295/Sq Ft
Est. Value
About This Home
This home is located at 164 Mott Hill Rd, East Hampton, CT 06424 and is currently estimated at $364,616, approximately $294 per square foot. 164 Mott Hill Rd is a home located in Middlesex County with nearby schools including Memorial School, Center Elementary School, and East Hampton Middle School.
Ownership History
Date
Name
Owned For
Owner Type
Purchase Details
Closed on
Jan 7, 2019
Sold by
Ghagan Craig and Ghagan Megan
Bought by
Ghagan Megan
Current Estimated Value
Purchase Details
Closed on
Jul 13, 2009
Sold by
Allen Gregory A
Bought by
Ghagan Craig and Conners Megan
Home Financials for this Owner
Home Financials are based on the most recent Mortgage that was taken out on this home.
Original Mortgage
$207,570
Interest Rate
4.93%
Purchase Details
Closed on
Jul 12, 2005
Sold by
Brazinskas Christopher J and Brazinskas Jo-An
Bought by
Allen Gregory A and Allen Jennifer G
Purchase Details
Closed on
Jul 1, 2002
Sold by
Chamberland Glenn M and Chamberland Marzena
Bought by
Brazinskas Christopher and Brazinskas Jo-Ann
Purchase Details
Closed on
Aug 15, 2000
Sold by
Peoples Jacqueline A
Bought by
Chamberland Glenn M and Chamberland Marzena
Create a Home Valuation Report for This Property
The Home Valuation Report is an in-depth analysis detailing your home's value as well as a comparison with similar homes in the area
Home Values in the Area
Average Home Value in this Area
Purchase History
| Date | Buyer | Sale Price | Title Company |
|---|---|---|---|
| Ghagan Megan | -- | -- | |
| Ghagan Megan | -- | -- | |
| Ghagan Craig | $221,500 | -- | |
| Ghagan Craig | $221,500 | -- | |
| Allen Gregory A | $242,500 | -- | |
| Allen Gregory A | $242,500 | -- | |
| Brazinskas Christopher | $161,000 | -- | |
| Brazinskas Christopher | $161,000 | -- | |
| Chamberland Glenn M | $135,000 | -- | |
| Chamberland Glenn M | $135,000 | -- |
Source: Public Records
Mortgage History
| Date | Status | Borrower | Loan Amount |
|---|---|---|---|
| Previous Owner | Chamberland Glenn M | $207,570 |
Source: Public Records
Tax History Compared to Growth
Tax History
| Year | Tax Paid | Tax Assessment Tax Assessment Total Assessment is a certain percentage of the fair market value that is determined by local assessors to be the total taxable value of land and additions on the property. | Land | Improvement |
|---|---|---|---|---|
| 2025 | $5,321 | $134,000 | $48,100 | $85,900 |
| 2024 | $5,097 | $134,000 | $48,100 | $85,900 |
| 2023 | $4,832 | $134,000 | $48,100 | $85,900 |
| 2022 | $4,645 | $134,010 | $48,110 | $85,900 |
| 2021 | $4,627 | $134,010 | $48,110 | $85,900 |
| 2020 | $4,482 | $135,240 | $49,020 | $86,220 |
| 2019 | $4,623 | $139,490 | $50,400 | $89,090 |
| 2018 | $4,369 | $139,490 | $50,400 | $89,090 |
| 2017 | $4,369 | $139,490 | $50,400 | $89,090 |
| 2016 | $4,107 | $139,490 | $50,400 | $89,090 |
| 2015 | $3,798 | $136,720 | $48,510 | $88,210 |
| 2014 | $3,305 | $136,720 | $48,510 | $88,210 |
Source: Public Records
Map
Nearby Homes