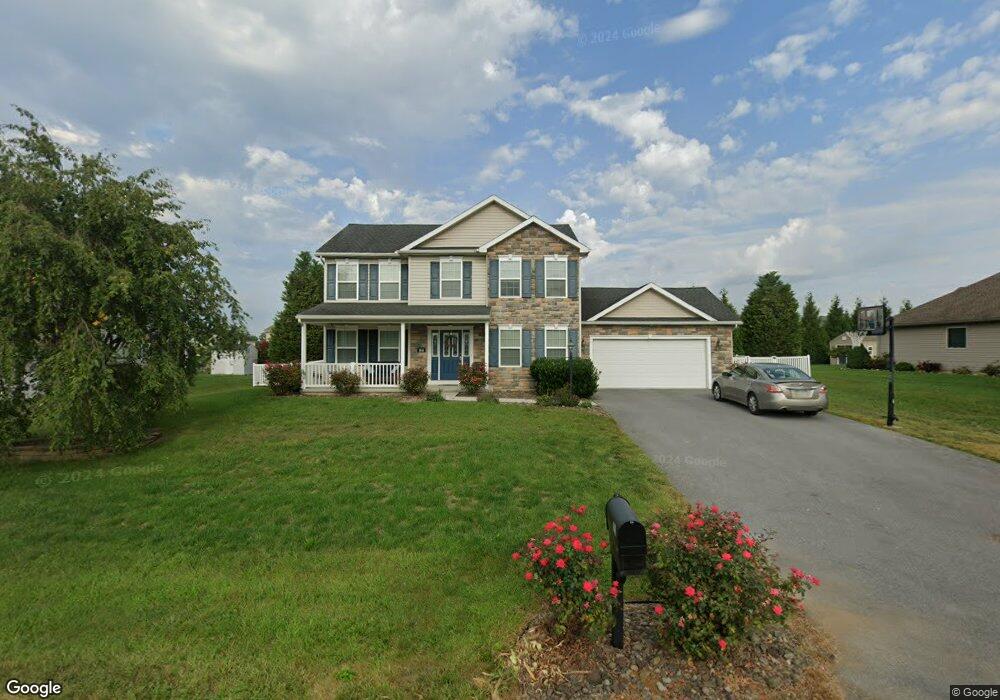
164 Sunbeam Place Greencastle, PA 17225
Estimated Value: $387,000 - $461,702
4
Beds
3
Baths
2,016
Sq Ft
$213/Sq Ft
Est. Value
About This Home
This home is located at 164 Sunbeam Place, Greencastle, PA 17225 and is currently estimated at $429,926, approximately $213 per square foot. 164 Sunbeam Place is a home located in Franklin County with nearby schools including Greencastle-Antrim Primary School, Greencastle-Antrim Elementary School, and Greencastle-Antrim Middle School.
Ownership History
Date
Name
Owned For
Owner Type
Purchase Details
Closed on
Jul 12, 2019
Sold by
Smiley Dean A and Smiley Beth A
Bought by
Bowman Eric M and Bowman Sallianne
Current Estimated Value
Home Financials for this Owner
Home Financials are based on the most recent Mortgage that was taken out on this home.
Original Mortgage
$266,400
Outstanding Balance
$233,390
Interest Rate
3.82%
Mortgage Type
New Conventional
Estimated Equity
$196,536
Purchase Details
Closed on
Oct 28, 2009
Sold by
Divinity Investments Llc
Bought by
Smiley Dean A and Smiley Beth A
Home Financials for this Owner
Home Financials are based on the most recent Mortgage that was taken out on this home.
Original Mortgage
$198,320
Interest Rate
5.06%
Mortgage Type
New Conventional
Create a Home Valuation Report for This Property
The Home Valuation Report is an in-depth analysis detailing your home's value as well as a comparison with similar homes in the area
Home Values in the Area
Average Home Value in this Area
Purchase History
| Date | Buyer | Sale Price | Title Company |
|---|---|---|---|
| Bowman Eric M | $296,000 | None Available | |
| Smiley Dean A | $247,900 | None Available |
Source: Public Records
Mortgage History
| Date | Status | Borrower | Loan Amount |
|---|---|---|---|
| Open | Bowman Eric M | $266,400 | |
| Previous Owner | Smiley Dean A | $198,320 |
Source: Public Records
Tax History Compared to Growth
Tax History
| Year | Tax Paid | Tax Assessment Tax Assessment Total Assessment is a certain percentage of the fair market value that is determined by local assessors to be the total taxable value of land and additions on the property. | Land | Improvement |
|---|---|---|---|---|
| 2025 | $5,114 | $30,570 | $4,250 | $26,320 |
| 2024 | $4,640 | $30,570 | $4,250 | $26,320 |
| 2023 | $4,585 | $30,570 | $4,250 | $26,320 |
| 2022 | $4,585 | $30,570 | $4,250 | $26,320 |
| 2021 | $4,496 | $30,570 | $4,250 | $26,320 |
| 2020 | $4,379 | $30,570 | $4,250 | $26,320 |
| 2019 | $4,280 | $30,570 | $4,250 | $26,320 |
| 2018 | $4,234 | $30,570 | $4,250 | $26,320 |
| 2017 | $4,127 | $30,570 | $4,250 | $26,320 |
| 2016 | $876 | $30,570 | $4,250 | $26,320 |
| 2015 | $816 | $30,570 | $4,250 | $26,320 |
| 2014 | $816 | $30,570 | $4,250 | $26,320 |
Source: Public Records
Map
Nearby Homes
- 12976 Daybreak Ln
- 763 Joy Dr
- 1223 E Pebblebrook Dr
- 11498 Nicole Dr
- 11765 Melrose Ave
- 281 Toms Ln
- 20 Helens Dr
- 707 Shook Ct W
- 480 S Carlisle St
- 375 Carolle St
- 34.77 Acres Red Oak Estate S
- 12689 Williamsport Pike
- 775 Lohman Ave
- 10135 Jasper Dr
- 382 Teaberry Dr
- 10937 Grant Shook Rd
- 10925 Grant Shook Rd
- 674 Lohman Ave
- 431 Leitersburg St
- 45 W Dahlgren St
- 135 Sunbeam Place
- 178 Sunbeam Place
- 132 Sunbeam Place
- 153 Sunbeam Place
- 5670 Tranquil Way
- 189 Sunbeam Place
- 1 Sunbeam Place
- 845 Raeann Dr
- 847 Raeann Dr
- 801 Raeann Dr
- 821 Raeann Dr
- 812 Raeann Dr
- 810 Raeann Dr
- 768 Raeann Dr
- 908 Raeann Dr
- 930 Raeann Dr
- 753 Raeann Dr
- 743 Raeann Dr
- 741 Raeann Dr
- 728 Raeann Dr