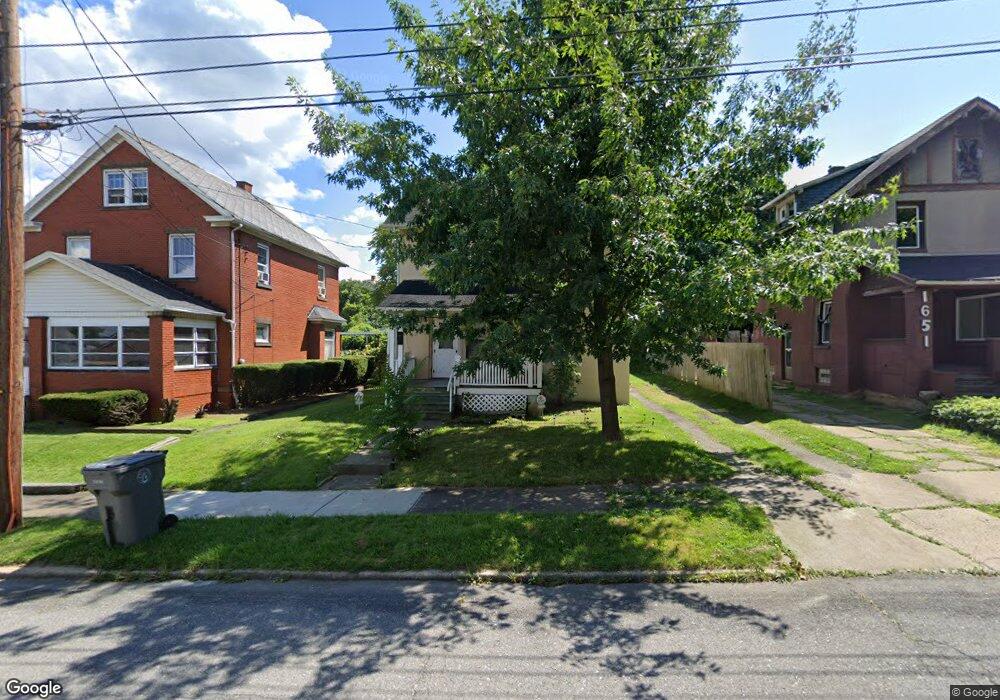
1647 Midland Ave Youngstown, OH 44509
Steelton NeighborhoodEstimated Value: $45,004 - $55,000
3
Beds
1
Bath
1,150
Sq Ft
$43/Sq Ft
Est. Value
About This Home
This home is located at 1647 Midland Ave, Youngstown, OH 44509 and is currently estimated at $49,335, approximately $42 per square foot. 1647 Midland Ave is a home located in Mahoning County with nearby schools including Volney Rogers Elementary School, Chaney High School, and Summit Academy - Youngstown.
Ownership History
Date
Name
Owned For
Owner Type
Purchase Details
Closed on
Dec 25, 2023
Sold by
1647 Midland Land Trust and Fay Sharron
Bought by
Silva Ivan Laviena
Current Estimated Value
Purchase Details
Closed on
Sep 14, 2022
Bought by
Sharron Fay
Purchase Details
Closed on
Jun 1, 2015
Sold by
Makis Kris
Bought by
Mcentegart David and Mcentegart Kathleen
Home Financials for this Owner
Home Financials are based on the most recent Mortgage that was taken out on this home.
Original Mortgage
$17,400
Interest Rate
3.75%
Mortgage Type
Seller Take Back
Purchase Details
Closed on
Nov 9, 2009
Sold by
Campanello Susan
Bought by
Cunningham Jill
Purchase Details
Closed on
Aug 3, 2007
Sold by
Emmanuel Giovanni Eleanor and Emmanuel Giovanni
Bought by
Campanello Susan
Purchase Details
Closed on
Oct 16, 2002
Sold by
Estate Of Edward M Lipjanic
Bought by
Giovanni Eleanor Jean and Campanello Susan
Purchase Details
Closed on
Feb 25, 1992
Bought by
Giovanni Eleanor J
Create a Home Valuation Report for This Property
The Home Valuation Report is an in-depth analysis detailing your home's value as well as a comparison with similar homes in the area
Home Values in the Area
Average Home Value in this Area
Purchase History
| Date | Buyer | Sale Price | Title Company |
|---|---|---|---|
| Silva Ivan Laviena | $19,000 | None Listed On Document | |
| Sharron Fay | -- | -- | |
| Mcentegart David | $19,500 | Attorney | |
| Cunningham Jill | $16,000 | None Available | |
| Campanello Susan | -- | None Available | |
| Giovanni Eleanor Jean | -- | -- | |
| Giovanni Eleanor J | -- | -- |
Source: Public Records
Mortgage History
| Date | Status | Borrower | Loan Amount |
|---|---|---|---|
| Previous Owner | Mcentegart David | $17,400 |
Source: Public Records
Tax History Compared to Growth
Tax History
| Year | Tax Paid | Tax Assessment Tax Assessment Total Assessment is a certain percentage of the fair market value that is determined by local assessors to be the total taxable value of land and additions on the property. | Land | Improvement |
|---|---|---|---|---|
| 2024 | $384 | $7,820 | $900 | $6,920 |
| 2023 | $382 | $7,820 | $900 | $6,920 |
| 2022 | $285 | $4,490 | $900 | $3,590 |
| 2021 | $285 | $4,490 | $900 | $3,590 |
| 2020 | $287 | $4,490 | $900 | $3,590 |
| 2019 | $288 | $4,010 | $810 | $3,200 |
| 2018 | $291 | $4,010 | $810 | $3,200 |
| 2017 | $324 | $4,010 | $810 | $3,200 |
| 2016 | $360 | $5,410 | $1,040 | $4,370 |
| 2015 | $353 | $5,410 | $1,040 | $4,370 |
| 2014 | $341 | $5,410 | $1,040 | $4,370 |
| 2013 | $336 | $5,410 | $1,040 | $4,370 |
Source: Public Records
Map
Nearby Homes
- 1726 Midland Ave
- 1639 Butler Ave
- 1711 Wellington Ave
- 1611 Wellington Ave
- 219 N Maryland Ave
- 1516 Midland Ave
- 1947 Manhattan Ave
- 626 Leadville Ave
- 60 Steel St
- 2113 Manhattan Ave
- 77 Fernwood Ave
- 1594 2nd St
- 134 Millet Ave
- 2129 Tippecanoe Ave
- 1595 2nd St
- 2101 Cherry Hill Ave
- 1751 Mahoning Ave
- 15 S Portland Ave
- 175 N Hartford Ave
- 107 N Hartford Ave
- 1643 Midland Ave
- 1651 Midland Ave
- 1655 Midland Ave
- 1635 Midland Ave
- 1648 Manhattan Ave
- 1644 Manhattan Ave
- 1652 Manhattan Ave
- 1659 Midland Ave
- 1633 Midland Ave
- 1640 Manhattan Ave
- 1656 Manhattan Ave
- 1629 Midland Ave
- 1638 Manhattan Ave
- 1660 Manhattan Ave
- 1640 Midland Ave
- 1628 Manhattan Ave
- 1625 Midland Ave
- 1636 Midland Ave
- 1703 Midland Ave
- 613 N Lakeview Ave