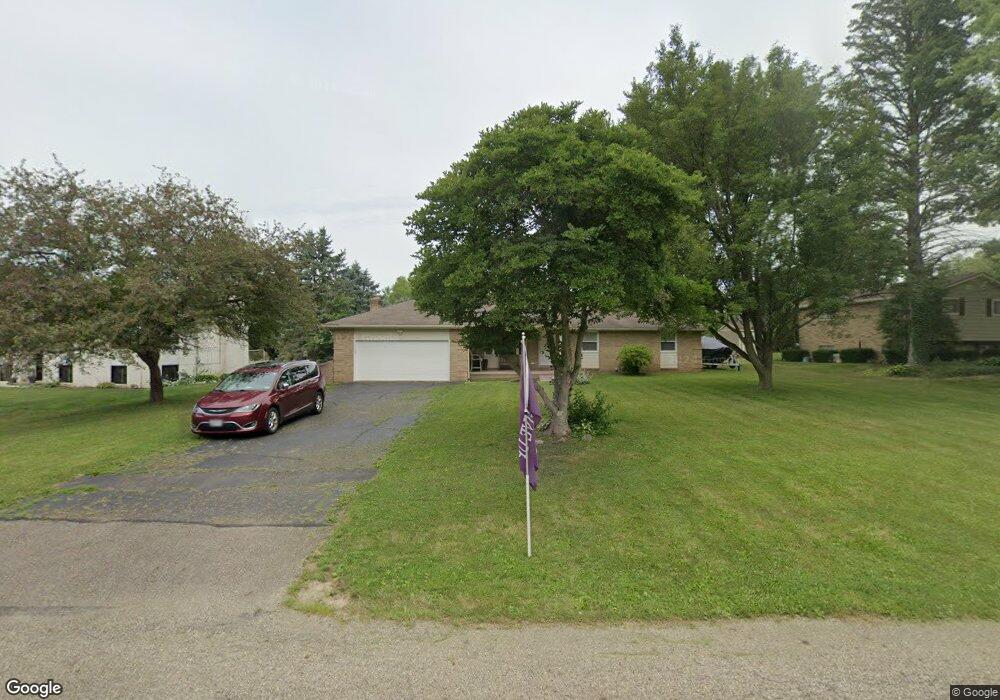
1649 Monter Ave Louisville, OH 44641
Estimated Value: $227,000 - $272,000
3
Beds
3
Baths
1,383
Sq Ft
$178/Sq Ft
Est. Value
About This Home
This home is located at 1649 Monter Ave, Louisville, OH 44641 and is currently estimated at $246,665, approximately $178 per square foot. 1649 Monter Ave is a home located in Stark County with nearby schools including Louisville High School and St. Thomas Aquinas High School & Middle School.
Ownership History
Date
Name
Owned For
Owner Type
Purchase Details
Closed on
Aug 8, 2018
Sold by
Sheldon Sean and Sheldon Jennifer J
Bought by
Pool Brian S and Pool Michelle L
Current Estimated Value
Home Financials for this Owner
Home Financials are based on the most recent Mortgage that was taken out on this home.
Original Mortgage
$162,000
Outstanding Balance
$140,690
Interest Rate
4.5%
Mortgage Type
New Conventional
Estimated Equity
$105,975
Purchase Details
Closed on
Nov 15, 2017
Sold by
Gersna Shirley L
Bought by
Sheldon Sean
Purchase Details
Closed on
Jul 15, 1999
Sold by
Theiss Timothy K and Theiss Patricia
Bought by
Gersna Shirley L
Purchase Details
Closed on
Nov 30, 1993
Purchase Details
Closed on
Jul 7, 1988
Create a Home Valuation Report for This Property
The Home Valuation Report is an in-depth analysis detailing your home's value as well as a comparison with similar homes in the area
Home Values in the Area
Average Home Value in this Area
Purchase History
| Date | Buyer | Sale Price | Title Company |
|---|---|---|---|
| Pool Brian S | $162,000 | None Available | |
| Sheldon Sean | $85,000 | Heritage Union Title Co Ltd | |
| Gersna Shirley L | $128,900 | Mk Title Agency Of Stark Cou | |
| -- | $105,000 | -- | |
| -- | $81,500 | -- |
Source: Public Records
Mortgage History
| Date | Status | Borrower | Loan Amount |
|---|---|---|---|
| Open | Pool Brian S | $162,000 |
Source: Public Records
Tax History Compared to Growth
Tax History
| Year | Tax Paid | Tax Assessment Tax Assessment Total Assessment is a certain percentage of the fair market value that is determined by local assessors to be the total taxable value of land and additions on the property. | Land | Improvement |
|---|---|---|---|---|
| 2025 | -- | $65,110 | $17,890 | $47,220 |
| 2024 | -- | $65,110 | $17,890 | $47,220 |
| 2023 | $2,514 | $58,490 | $16,910 | $41,580 |
| 2022 | $1,260 | $58,490 | $16,910 | $41,580 |
| 2021 | $2,526 | $58,490 | $16,910 | $41,580 |
| 2020 | $2,095 | $52,680 | $15,230 | $37,450 |
| 2019 | $2,104 | $46,240 | $16,490 | $29,750 |
| 2018 | $1,893 | $46,240 | $16,490 | $29,750 |
| 2017 | $1,535 | $46,550 | $14,490 | $32,060 |
| 2016 | $1,574 | $46,550 | $14,490 | $32,060 |
| 2015 | $1,580 | $46,550 | $14,490 | $32,060 |
| 2014 | $1,429 | $40,190 | $12,500 | $27,690 |
| 2013 | $718 | $40,190 | $12,500 | $27,690 |
Source: Public Records
Map
Nearby Homes
- 1812 E Broad St
- 1715 High St
- 2015 E Main St
- 0 Michigan Blvd
- 308 Superior St
- 641 S Nickelplate St
- 520 S Silver St
- 2110 Edmar St
- 728 E Broad St
- 325 Lincoln Ave
- 1170 Winding Ridge Ave
- 204 E Broad St
- 510 S Bauman Ct
- 107 E Broad St
- 910 Crosswyck Cir
- 908 Sand Lot Cir
- 3390 Meese Rd NE
- 428 Honeycrisp Dr NE
- 3047 Mcintosh Dr NE
- 432 Honeycrisp Dr NE
- 1637 Monter Ave
- 1661 Monter Ave
- 253 Dogwood St
- 1625 Monter Ave
- 1654 Monter Ave
- 1664 Monter Ave
- 245 Dogwood St
- 1644 Monter Ave
- 1634 Monter Ave
- 1711 Monter Ave
- 1711 Monter Ave
- 1674 Monter Ave
- 1626 Monter Ave
- 310 S Marion Ave
- 320 S Marion Ave
- 300 S Marion Ave
- 235 Dogwood St
- 1706 Monter Ave
- 1614 Monter Ave
- 236 S Marion Ave