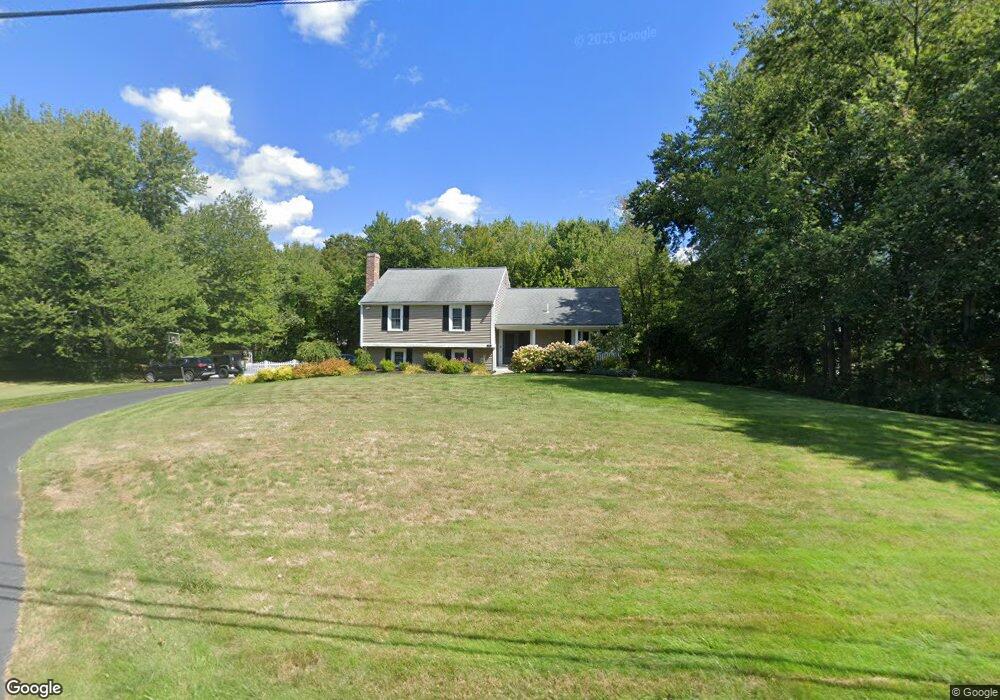
165 Brookwood Rd Hanover, MA 02339
Estimated Value: $687,000 - $858,000
3
Beds
2
Baths
1,336
Sq Ft
$570/Sq Ft
Est. Value
About This Home
This home is located at 165 Brookwood Rd, Hanover, MA 02339 and is currently estimated at $761,498, approximately $569 per square foot. 165 Brookwood Rd is a home located in Plymouth County with nearby schools including Hanover High School, South Shore Charter Public School, and Norwell KinderCare.
Ownership History
Date
Name
Owned For
Owner Type
Purchase Details
Closed on
Nov 30, 2022
Sold by
Kemp Bryan and Kemp Lainie
Bought by
Bryan and Laine Kemp
Current Estimated Value
Purchase Details
Closed on
Jun 20, 2007
Sold by
Mcinerney Sean J and Mcinerney Janice A
Bought by
Kemp Bryan and Kemp Lainie
Purchase Details
Closed on
Jul 16, 1999
Sold by
Woolf Gordon P and Woolf Leslee A
Bought by
Mcinerney Sean J and Mcinerney Janice A
Purchase Details
Closed on
Apr 29, 1994
Sold by
Smith Gregory J and Smith Tove V
Bought by
Woolf Gordon P and Woolf Leslee A
Purchase Details
Closed on
May 3, 1988
Sold by
Johnson Harvey D
Bought by
Smith Gregory J
Create a Home Valuation Report for This Property
The Home Valuation Report is an in-depth analysis detailing your home's value as well as a comparison with similar homes in the area
Home Values in the Area
Average Home Value in this Area
Purchase History
| Date | Buyer | Sale Price | Title Company |
|---|---|---|---|
| Bryan | -- | None Available | |
| Bryan | -- | None Available | |
| Kemp Bryan | $458,900 | -- | |
| Kemp Bryan | $458,900 | -- | |
| Mcinerney Sean J | $267,000 | -- | |
| Mcinerney Sean J | $267,000 | -- | |
| Woolf Gordon P | $197,925 | -- | |
| Woolf Gordon P | $197,925 | -- | |
| Smith Gregory J | $210,000 | -- |
Source: Public Records
Mortgage History
| Date | Status | Borrower | Loan Amount |
|---|---|---|---|
| Previous Owner | Smith Gregory J | $297,000 | |
| Previous Owner | Smith Gregory J | $302,000 |
Source: Public Records
Tax History Compared to Growth
Tax History
| Year | Tax Paid | Tax Assessment Tax Assessment Total Assessment is a certain percentage of the fair market value that is determined by local assessors to be the total taxable value of land and additions on the property. | Land | Improvement |
|---|---|---|---|---|
| 2025 | $8,447 | $684,000 | $325,000 | $359,000 |
| 2024 | $8,783 | $684,000 | $325,000 | $359,000 |
| 2023 | $8,878 | $658,100 | $295,300 | $362,800 |
| 2022 | $7,543 | $494,600 | $246,100 | $248,500 |
| 2021 | $7,744 | $474,200 | $223,800 | $250,400 |
| 2020 | $7,406 | $454,100 | $223,800 | $230,300 |
| 2019 | $7,055 | $429,900 | $223,800 | $206,100 |
| 2018 | $6,834 | $419,800 | $223,800 | $196,000 |
| 2017 | $7,009 | $424,300 | $233,700 | $190,600 |
| 2016 | $6,629 | $393,200 | $212,500 | $180,700 |
| 2015 | $6,662 | $412,500 | $231,800 | $180,700 |
Source: Public Records
Map
Nearby Homes
- 1239 Main St
- 70 Dillingham Way
- 118 Bates Way
- 375 Webster St
- 80 Coolidge Rd
- 120 Deerfield Ln
- 216 Whiting St
- 3 Blueberry Ct
- 276 Woodland Dr
- 214 Washington St Unit 24
- 214 Washington St Unit 28
- 18 Colby St
- 55 Turner Rd
- 53 Chestnut St
- 7 Assinippi Ave Unit 306
- 206-208 Hinghm St
- 18 Midfield Dr
- 436 E Water St
- 354 Webster St
- 62 Larchmont Ln
- 177 Brookwood Rd
- 129 Brookwood Rd
- 178 Brookwood Rd
- 164 Brookwood Rd
- 128 Cedarwood Rd
- 170 Cedarwood Rd
- 142 Cedarwood Rd
- 152 Brookwood Rd
- 116 Cedarwood Rd
- 136 Brookwood Rd
- 4 Damon Rd
- 117 Brookwood Rd
- 104 Cedarwood Rd
- 116 Brookwood Rd
- 151 Cedarwood Rd
- 139 Cedarwood Rd
- 105 Brookwood Rd
- 173 Cedarwood Rd
- 18 Damon Rd
- 163 Cedarwood Rd