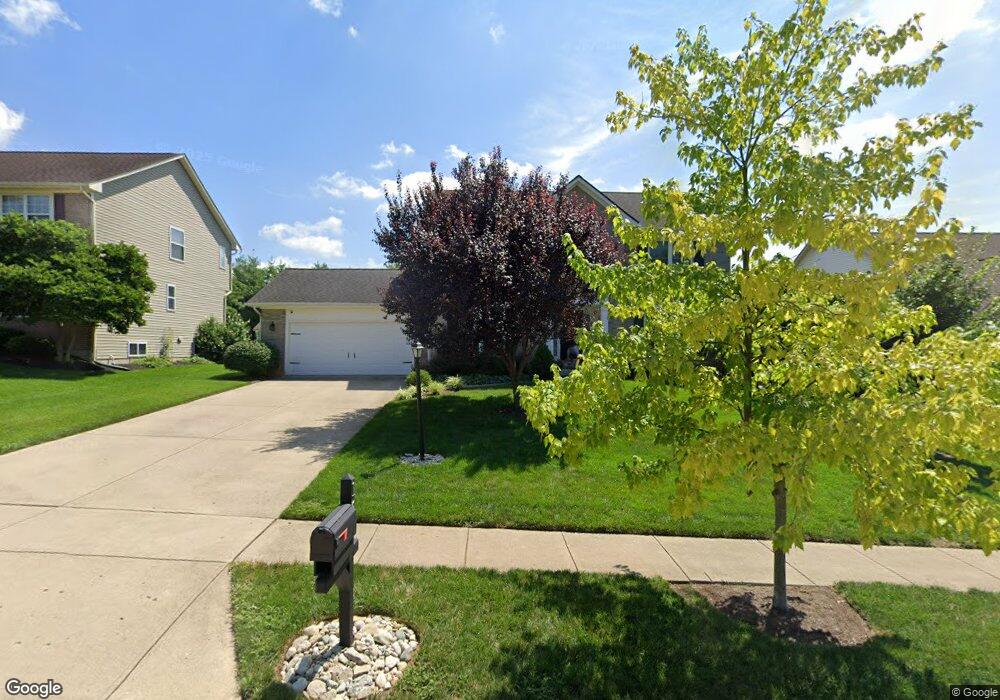
165 Steeplechase Dr Unit 27 Springboro, OH 45066
Estimated Value: $453,464 - $529,000
4
Beds
3
Baths
2,238
Sq Ft
$216/Sq Ft
Est. Value
About This Home
This home is located at 165 Steeplechase Dr Unit 27, Springboro, OH 45066 and is currently estimated at $483,116, approximately $215 per square foot. 165 Steeplechase Dr Unit 27 is a home located in Warren County with nearby schools including Clearcreek Elementary School, Springboro Intermediate School, and Dennis Elementary School.
Ownership History
Date
Name
Owned For
Owner Type
Purchase Details
Closed on
Jul 29, 2019
Sold by
Frye Peter C and Frye Kayla
Bought by
Bedell John L and Bedell Leah K
Current Estimated Value
Home Financials for this Owner
Home Financials are based on the most recent Mortgage that was taken out on this home.
Original Mortgage
$260,800
Outstanding Balance
$228,880
Interest Rate
3.8%
Mortgage Type
New Conventional
Estimated Equity
$254,236
Purchase Details
Closed on
Jan 17, 2017
Sold by
Green William H and Green Cynthia T
Bought by
Frye Peter C and Frye Kayla
Home Financials for this Owner
Home Financials are based on the most recent Mortgage that was taken out on this home.
Original Mortgage
$228,600
Interest Rate
4.3%
Mortgage Type
New Conventional
Create a Home Valuation Report for This Property
The Home Valuation Report is an in-depth analysis detailing your home's value as well as a comparison with similar homes in the area
Home Values in the Area
Average Home Value in this Area
Purchase History
| Date | Buyer | Sale Price | Title Company |
|---|---|---|---|
| Bedell John L | $328,000 | None Available | |
| Frye Peter C | $254,000 | None Available |
Source: Public Records
Mortgage History
| Date | Status | Borrower | Loan Amount |
|---|---|---|---|
| Open | Bedell John L | $260,800 | |
| Previous Owner | Frye Peter C | $228,600 |
Source: Public Records
Tax History Compared to Growth
Tax History
| Year | Tax Paid | Tax Assessment Tax Assessment Total Assessment is a certain percentage of the fair market value that is determined by local assessors to be the total taxable value of land and additions on the property. | Land | Improvement |
|---|---|---|---|---|
| 2024 | $4,954 | $124,820 | $35,000 | $89,820 |
| 2023 | $4,215 | $97,051 | $20,650 | $76,401 |
| 2022 | $4,151 | $97,052 | $20,650 | $76,402 |
| 2021 | $3,867 | $97,052 | $20,650 | $76,402 |
| 2020 | $3,749 | $82,247 | $17,500 | $64,747 |
| 2019 | $3,465 | $82,247 | $17,500 | $64,747 |
| 2018 | $3,389 | $82,247 | $17,500 | $64,747 |
| 2017 | $3,193 | $76,955 | $16,632 | $60,323 |
| 2016 | $3,324 | $76,955 | $16,632 | $60,323 |
| 2015 | $3,261 | $76,955 | $16,632 | $60,323 |
| 2014 | $3,090 | $69,960 | $15,120 | $54,840 |
| 2013 | $3,087 | $80,970 | $17,500 | $63,470 |
Source: Public Records
Map
Nearby Homes
- 261 Myrtle Ln
- 125 Dan Haven Place
- 62 Ed Knoll Bend
- 125 E Market St
- 200 Sycamore Creek Dr
- 1045 Ohio 73
- 473 Mccray Blvd
- 25 Chestnut St
- 55 Chestnut St
- 45 Chestnut St
- 85 Chestnut St
- 125 W Market St
- 120 Magnolia Ln
- 130 Magnolia Ln
- 15 Belvoir Ct
- Birmingham Plan at Clearview Crossing
- The Longwood Plan at Clearview Crossing
- Rockford Plan at Clearview Crossing
- Somerset Plan at Clearview Crossing
- Avalon Plan at Clearview Crossing
- 165 Steeplechase Dr
- 145 Steeplechase Dr
- 185 Steeplechase Dr
- 205 Steeplechase Dr
- 125 Steeplechase Dr
- 25 Triple Crown Cir
- 80 Richards Run
- 215 Steeplechase Dr
- 120 Steeplechase Dr
- 45 Triple Crown Cir
- 20 Triple Crown Cir
- 70 Richards Run
- 225 Steeplechase Dr
- 80 Steeplechase Dr
- 85 Richards Run
- 40 Triple Crown Cir
- 60 Richards Run
- 235 Steeplechase Dr
- 220 Steeplechase Dr
- 75 Richards Run