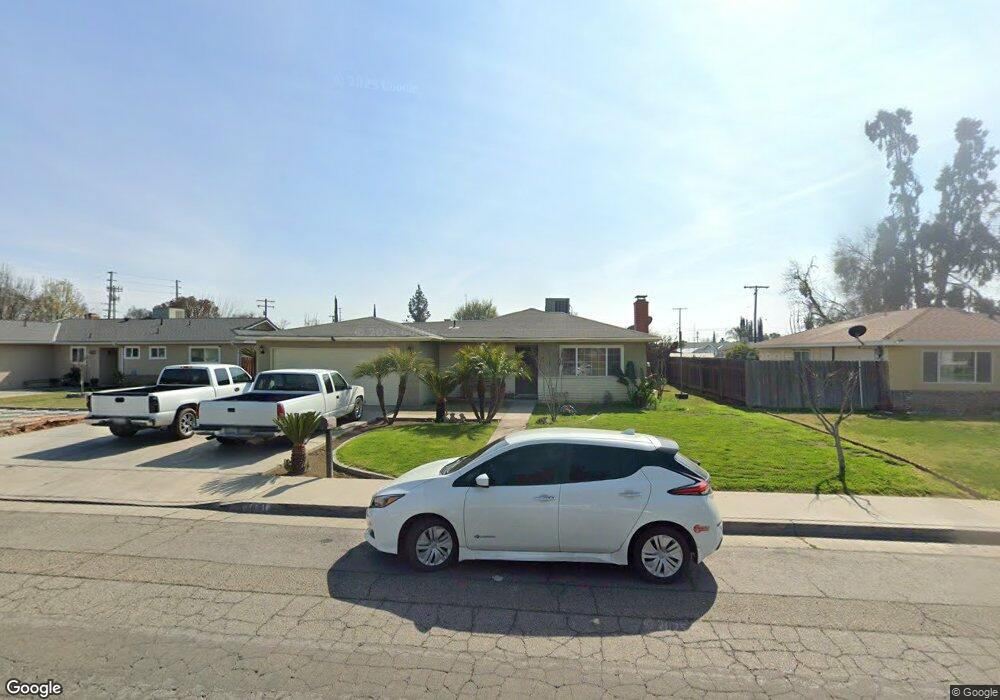
1651 W Kanai Ave Porterville, CA 93257
Porterville Northwest NeighborhoodEstimated Value: $300,016 - $335,000
3
Beds
2
Baths
1,180
Sq Ft
$267/Sq Ft
Est. Value
About This Home
This home is located at 1651 W Kanai Ave, Porterville, CA 93257 and is currently estimated at $314,754, approximately $266 per square foot. 1651 W Kanai Ave is a home located in Tulare County with nearby schools including Jim Maples Academy, Burton Middle School, and Monache High School.
Ownership History
Date
Name
Owned For
Owner Type
Purchase Details
Closed on
May 15, 2024
Sold by
Chavera Delia and Calderon Armando Gilbert
Bought by
Chavera Delia and Calderon Salvador
Current Estimated Value
Home Financials for this Owner
Home Financials are based on the most recent Mortgage that was taken out on this home.
Original Mortgage
$152,625
Outstanding Balance
$150,485
Interest Rate
6.88%
Mortgage Type
FHA
Estimated Equity
$164,269
Purchase Details
Closed on
May 20, 2016
Sold by
Chavera Simon
Bought by
Chavera Delia and Calderon Armando Gilbert
Home Financials for this Owner
Home Financials are based on the most recent Mortgage that was taken out on this home.
Original Mortgage
$90,000
Interest Rate
3.59%
Mortgage Type
Seller Take Back
Purchase Details
Closed on
Nov 12, 2004
Sold by
Calderon Salvadore
Bought by
Chavera Simon
Purchase Details
Closed on
Jan 8, 1998
Sold by
Chavera Lucio
Bought by
Chavera Delia
Create a Home Valuation Report for This Property
The Home Valuation Report is an in-depth analysis detailing your home's value as well as a comparison with similar homes in the area
Home Values in the Area
Average Home Value in this Area
Purchase History
| Date | Buyer | Sale Price | Title Company |
|---|---|---|---|
| Chavera Delia | -- | Commonwealth Land Title | |
| Chavera Delia | $90,000 | None Available | |
| Chavera Simon | -- | -- | |
| Chavera Delia | -- | -- |
Source: Public Records
Mortgage History
| Date | Status | Borrower | Loan Amount |
|---|---|---|---|
| Open | Chavera Delia | $152,625 | |
| Previous Owner | Chavera Delia | $90,000 |
Source: Public Records
Tax History Compared to Growth
Tax History
| Year | Tax Paid | Tax Assessment Tax Assessment Total Assessment is a certain percentage of the fair market value that is determined by local assessors to be the total taxable value of land and additions on the property. | Land | Improvement |
|---|---|---|---|---|
| 2025 | $1,617 | $153,890 | $41,431 | $112,459 |
| 2024 | $1,617 | $150,873 | $40,619 | $110,254 |
| 2023 | $1,559 | $147,916 | $39,823 | $108,093 |
| 2022 | $1,559 | $145,017 | $39,043 | $105,974 |
| 2021 | $2,819 | $142,173 | $38,277 | $103,896 |
| 2020 | $1,507 | $140,716 | $37,885 | $102,831 |
| 2019 | $1,506 | $137,957 | $37,142 | $100,815 |
| 2018 | $1,439 | $135,252 | $36,414 | $98,838 |
| 2017 | $1,411 | $132,115 | $48,041 | $84,074 |
| 2016 | $1,345 | $129,524 | $47,099 | $82,425 |
| 2015 | $1,321 | $127,000 | $32,000 | $95,000 |
| 2014 | $1,234 | $119,000 | $30,000 | $89,000 |
Source: Public Records
Map
Nearby Homes
- 1730 W Grand Ave
- 1690 Memory Ln
- 595 N Salisbury St
- 1771 W Aurora Ct
- 1644 Mccomb Ave
- 1343 W Morton Ave Unit Sp 84
- 1691 Terry Ct
- 1750 W Terry Cir
- 1482 Tomah Ave
- 251301037 Tomah Ave
- 2070 W Harrison Ave
- 700 N Prospect St
- 640 N Prospect St
- 313 Balmoral Dr
- 1041 Greenfield Dr
- 474 Douglas St
- 1087 W Belleview Ave
- 1076 N Beverly St
- 1060 W Belleview Ave
- 1262 Tomah Ave
- 1651 W Kanai Ave
- 1661 W Kanai Ave
- 1641 W Kanai Ave
- 1671 W Kanai Ave Unit 1
- 1671 W Kanai Ave
- 1631 W Kanai Ave
- 1650 W Kanai Ave
- 1660 W Kanai Ave
- 1640 W Kanai Ave
- 1662 W Belleview Ave
- 1681 W Kanai Ave
- 1621 W Kanai Ave
- 1670 W Kanai Ave
- 1630 W Kanai Ave
- 1652 W Belleview Ave
- 1678 W Belleview Ave
- 1661 W Grand Ave
- 1680 W Kanai Ave
- 1651 W Grand Ave
- 1620 W Kanai Ave