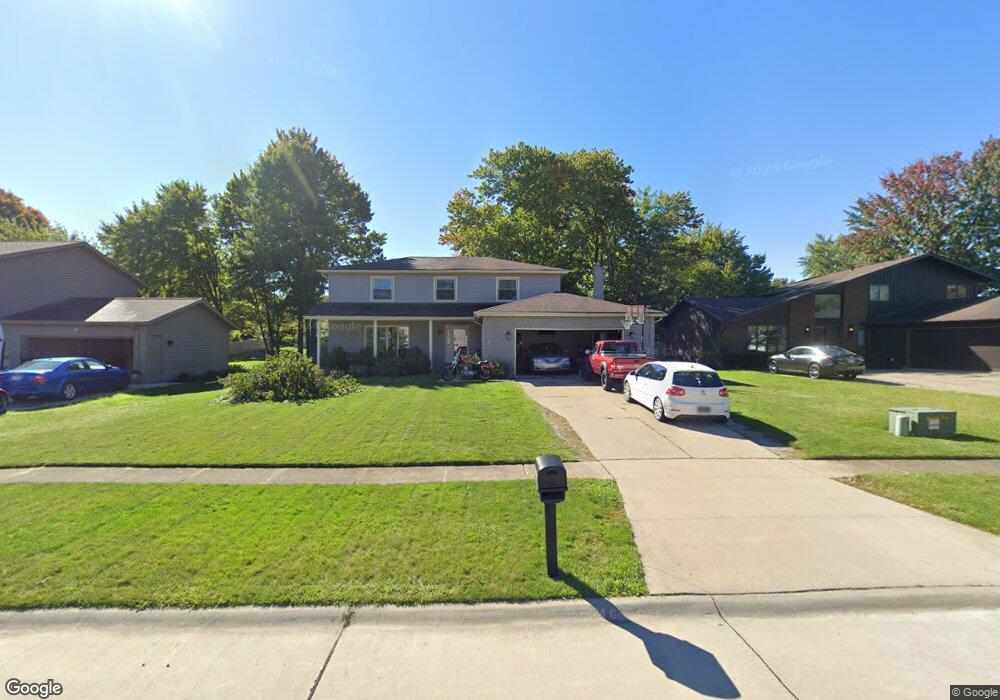
16515 N Red Rock Dr Strongsville, OH 44136
Estimated Value: $356,064 - $391,000
4
Beds
3
Baths
2,262
Sq Ft
$164/Sq Ft
Est. Value
About This Home
This home is located at 16515 N Red Rock Dr, Strongsville, OH 44136 and is currently estimated at $371,766, approximately $164 per square foot. 16515 N Red Rock Dr is a home located in Cuyahoga County with nearby schools including Strongsville High School.
Ownership History
Date
Name
Owned For
Owner Type
Purchase Details
Closed on
Dec 18, 2020
Sold by
Denoto Tricia R
Bought by
Denoto Joseph V
Current Estimated Value
Home Financials for this Owner
Home Financials are based on the most recent Mortgage that was taken out on this home.
Original Mortgage
$197,864
Interest Rate
2.7%
Mortgage Type
New Conventional
Purchase Details
Closed on
Jan 10, 2005
Sold by
Moore James A and Moore Karen L
Bought by
Denoto Joseph and Denoto Tricia R
Home Financials for this Owner
Home Financials are based on the most recent Mortgage that was taken out on this home.
Original Mortgage
$153,600
Interest Rate
5.75%
Mortgage Type
Purchase Money Mortgage
Purchase Details
Closed on
Aug 8, 1985
Sold by
Klaus Earnest A
Bought by
Moore James A
Purchase Details
Closed on
May 3, 1982
Sold by
Bryant Steven
Bought by
Klaus Earnest A
Purchase Details
Closed on
Aug 1, 1979
Bought by
Bryant Steven
Purchase Details
Closed on
Jan 1, 1977
Bought by
Sherwood Const Co
Create a Home Valuation Report for This Property
The Home Valuation Report is an in-depth analysis detailing your home's value as well as a comparison with similar homes in the area
Home Values in the Area
Average Home Value in this Area
Purchase History
| Date | Buyer | Sale Price | Title Company |
|---|---|---|---|
| Denoto Joseph V | -- | Emerald Glen Title Agency | |
| Denoto Joseph | $192,000 | Signature Title | |
| Moore James A | $111,000 | -- | |
| Klaus Earnest A | $98,000 | -- | |
| Bryant Steven | $95,000 | -- | |
| Sherwood Const Co | -- | -- |
Source: Public Records
Mortgage History
| Date | Status | Borrower | Loan Amount |
|---|---|---|---|
| Previous Owner | Denoto Joseph V | $197,864 | |
| Previous Owner | Denoto Joseph | $153,600 | |
| Closed | Denoto Joseph | $38,400 |
Source: Public Records
Tax History Compared to Growth
Tax History
| Year | Tax Paid | Tax Assessment Tax Assessment Total Assessment is a certain percentage of the fair market value that is determined by local assessors to be the total taxable value of land and additions on the property. | Land | Improvement |
|---|---|---|---|---|
| 2024 | $4,930 | $105,000 | $22,015 | $82,985 |
| 2023 | $5,324 | $85,020 | $22,300 | $62,720 |
| 2022 | $5,285 | $85,020 | $22,300 | $62,720 |
| 2021 | $5,243 | $85,020 | $22,300 | $62,720 |
| 2020 | $4,858 | $69,690 | $18,270 | $51,420 |
| 2019 | $4,716 | $199,100 | $52,200 | $146,900 |
| 2018 | $4,270 | $69,690 | $18,270 | $51,420 |
| 2017 | $4,340 | $65,420 | $14,460 | $50,960 |
| 2016 | $4,305 | $65,420 | $14,460 | $50,960 |
| 2015 | $4,365 | $65,420 | $14,460 | $50,960 |
| 2014 | $4,365 | $65,420 | $14,460 | $50,960 |
Source: Public Records
Map
Nearby Homes
- 16486 S Red Rock Dr
- 17159 Turkey Meadow Ln
- 17130 Golden Star Dr
- 17682 Drake Rd
- 17024 Bear Creek Ln
- 18229 Howe Rd
- 16650 Lanier Ave
- 16711 Beech Cir
- 18294 Drake Rd
- 17934 Cambridge Oval
- 18411 Yorktown Oval
- 16450 Howe Rd
- 17069 Partridge Dr
- 3550 Boston Rd
- 14985 Camden Cir
- 19694 Benbow Rd
- 15604-REAR Boston Rd
- 18162 Fawn Cir
- 18987 Laurell Cir
- 18848 Pearl Rd
- 16511 N Red Rock Dr
- 16519 N Red Rock Dr
- 16507 N Red Rock Dr
- 16548 S Red Rock Dr
- 16525 N Red Rock Dr
- 16544 S Red Rock Dr
- 16552 S Red Rock Dr
- 16529 N Red Rock Dr
- 16503 N Red Rock Dr
- 16540 S Red Rock Dr
- 16514 N Red Rock Dr
- 16518 N Red Rock Dr
- 16510 N Red Rock Dr
- 16522 N Red Rock Dr
- 16533 N Red Rock Dr
- 16536 S Red Rock Dr
- 16506 N Red Rock Dr
- 16499 N Red Rock Dr
- 16526 N Red Rock Dr
- 16502 N Red Rock Dr