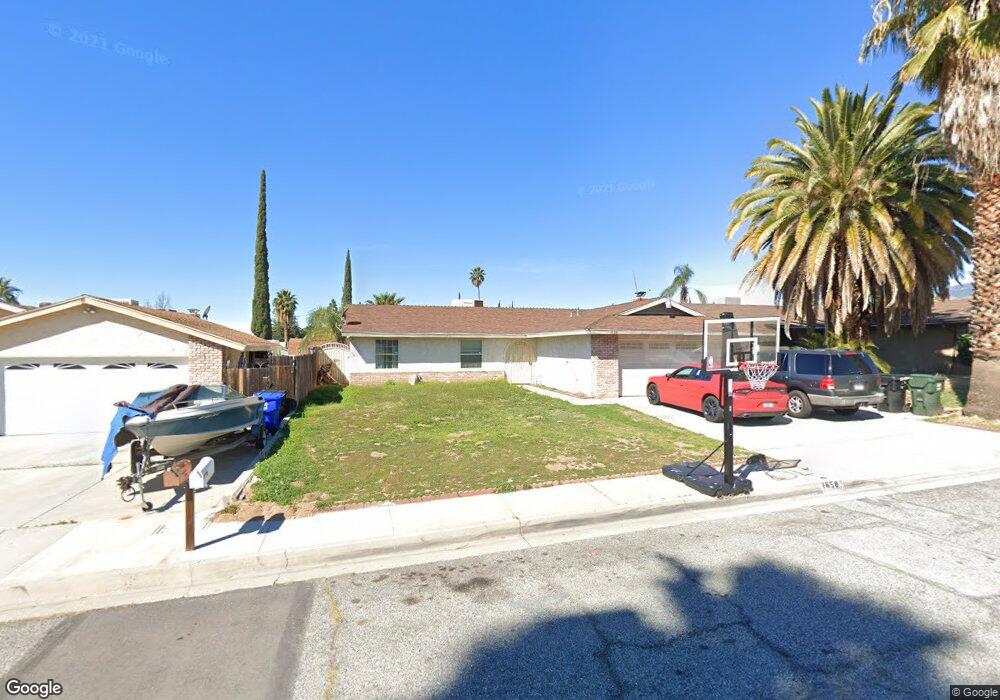
1658 Catalpa Ave Highland, CA 92346
Crossroads NeighborhoodEstimated Value: $533,000 - $580,000
4
Beds
2
Baths
1,566
Sq Ft
$359/Sq Ft
Est. Value
About This Home
This home is located at 1658 Catalpa Ave, Highland, CA 92346 and is currently estimated at $561,884, approximately $358 per square foot. 1658 Catalpa Ave is a home located in San Bernardino County with nearby schools including Thompson Elementary School, Serrano Middle School, and San Gorgonio High School.
Ownership History
Date
Name
Owned For
Owner Type
Purchase Details
Closed on
Jan 13, 2020
Sold by
King Audwin
Bought by
Allen Trashaun S and Torrence Roshaun J
Current Estimated Value
Home Financials for this Owner
Home Financials are based on the most recent Mortgage that was taken out on this home.
Original Mortgage
$162,587
Interest Rate
3.3%
Mortgage Type
FHA
Purchase Details
Closed on
Apr 30, 2003
Sold by
Torrence Roshaun
Bought by
King Audwin
Home Financials for this Owner
Home Financials are based on the most recent Mortgage that was taken out on this home.
Original Mortgage
$169,650
Interest Rate
7.75%
Purchase Details
Closed on
Sep 24, 2002
Sold by
Parker Regina C
Bought by
C & G Investments & Research
Purchase Details
Closed on
Mar 24, 2000
Sold by
Parker Regina C
Bought by
Chase Mtg Company West and Mellon Mtg Company
Create a Home Valuation Report for This Property
The Home Valuation Report is an in-depth analysis detailing your home's value as well as a comparison with similar homes in the area
Home Values in the Area
Average Home Value in this Area
Purchase History
| Date | Buyer | Sale Price | Title Company |
|---|---|---|---|
| Allen Trashaun S | $166,000 | Priority Title | |
| King Audwin | -- | Commonwealth Title | |
| King Audwin | $188,500 | Commonwealth Title | |
| C & G Investments & Research | $120,306 | -- | |
| Chase Mtg Company West | $118,232 | American Title |
Source: Public Records
Mortgage History
| Date | Status | Borrower | Loan Amount |
|---|---|---|---|
| Previous Owner | Allen Trashaun S | $162,587 | |
| Previous Owner | King Audwin | $169,650 |
Source: Public Records
Tax History Compared to Growth
Tax History
| Year | Tax Paid | Tax Assessment Tax Assessment Total Assessment is a certain percentage of the fair market value that is determined by local assessors to be the total taxable value of land and additions on the property. | Land | Improvement |
|---|---|---|---|---|
| 2025 | $5,436 | $409,631 | $114,833 | $294,798 |
| 2024 | $5,436 | $401,599 | $112,581 | $289,018 |
| 2023 | $5,109 | $393,725 | $110,374 | $283,351 |
| 2022 | $5,350 | $386,005 | $108,210 | $277,795 |
| 2021 | $4,868 | $363,730 | $106,088 | $257,642 |
| 2020 | $3,436 | $249,635 | $59,595 | $190,040 |
| 2019 | $3,334 | $244,740 | $58,426 | $186,314 |
| 2018 | $3,296 | $239,941 | $57,280 | $182,661 |
| 2017 | $3,195 | $235,236 | $56,157 | $179,079 |
| 2016 | $3,099 | $230,624 | $55,056 | $175,568 |
| 2015 | $3,006 | $227,160 | $54,229 | $172,931 |
| 2014 | $2,923 | $222,711 | $53,167 | $169,544 |
Source: Public Records
Map
Nearby Homes
- 6941 La Praix St
- 27953 Atlantic Ave
- 28037 Clifton St
- 27875 Rainbow Ln
- 27888 Rainbow Ln
- 7001 Church Ave Unit 5
- 27856 Fieldstone Dr
- 6986 Church Ave
- 27471 Main St
- 0 La Praix St
- 3850 Atlantic Ave Unit 58
- 3850 Atlantic Ave Unit 217
- 3850 Atlantic Ave Unit 275
- 3850 Atlantic Ave Unit 296
- 3850 Atlantic Ave Unit 257
- 3850 Atlantic Ave Unit 27
- 3850 Atlantic Ave Unit 274
- 3850 Atlantic Ave Unit 60
- 3850 Atlantic Ave Unit 151
- 3850 Atlantic Ave Unit 80
- 4172 Pasito St
- 1694 Catalpa Ave
- 1659 Rhone Ave
- 4142 Pasito St
- 1679 Rhone Ave
- 1659 Catalpa Ave
- 1695 Rhone Ave
- 1677 Catalpa Ave
- 1704 Catalpa Ave
- 1641 Catalpa Ave
- 4165 Pasito St
- 4179 Pasito St
- 4149 Pasito St
- 1695 Catalpa Ave
- 1705 Rhone Ave
- 1623 Catalpa Ave
- 4135 Pasito St
- 4195 Pasito St
- 1705 Catalpa Ave
- 1722 Catalpa Ave