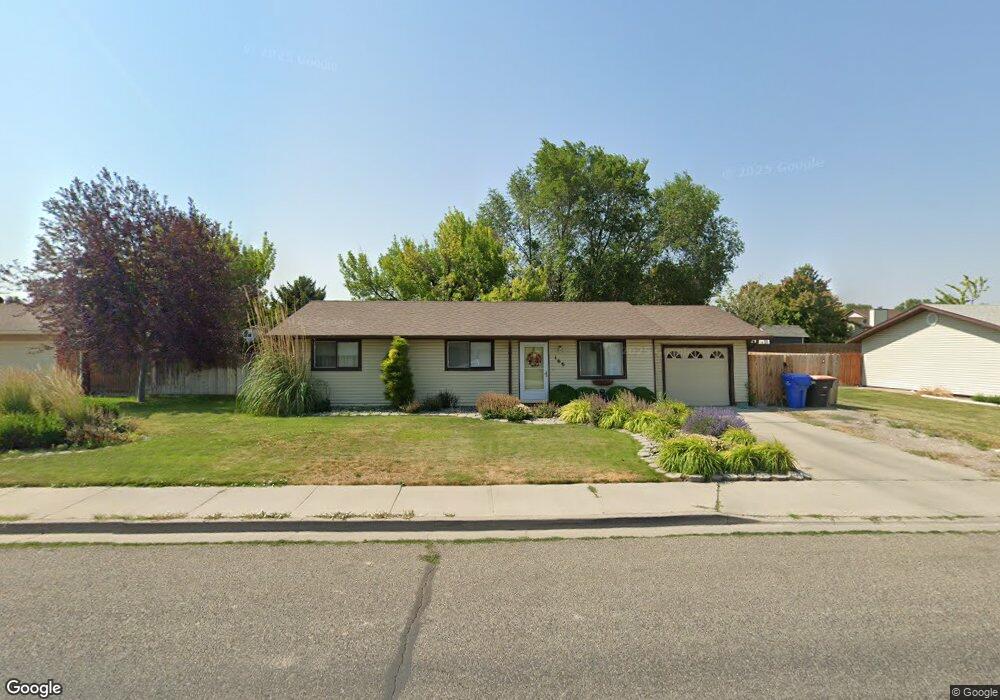
166 El Camino Ave Twin Falls, ID 83301
Estimated Value: $258,000 - $305,000
3
Beds
1
Bath
1,040
Sq Ft
$275/Sq Ft
Est. Value
About This Home
This home is located at 166 El Camino Ave, Twin Falls, ID 83301 and is currently estimated at $285,629, approximately $274 per square foot. 166 El Camino Ave is a home located in Twin Falls County with nearby schools including Oregon Trail Elementary School, South Hills Middle School, and Twin Falls Senior High School.
Ownership History
Date
Name
Owned For
Owner Type
Purchase Details
Closed on
Sep 18, 2023
Sold by
Idaho Land Holding Llc
Bought by
Prosperity Partners Llc
Current Estimated Value
Purchase Details
Closed on
Feb 13, 2017
Sold by
Barker Lex A
Bought by
Barker Sarah M and Thornborrow Sara Mae
Purchase Details
Closed on
Jul 21, 2015
Sold by
Lassiter Robert C and Lassiter Melissa E
Bought by
Baker Sarah M and Baker Lex A
Home Financials for this Owner
Home Financials are based on the most recent Mortgage that was taken out on this home.
Original Mortgage
$119,515
Interest Rate
3.98%
Mortgage Type
VA
Purchase Details
Closed on
Dec 11, 2006
Sold by
Petersen Julie M
Bought by
Lassiter Robert C and Lassiter Melissa E
Home Financials for this Owner
Home Financials are based on the most recent Mortgage that was taken out on this home.
Original Mortgage
$120,200
Interest Rate
6.38%
Mortgage Type
New Conventional
Create a Home Valuation Report for This Property
The Home Valuation Report is an in-depth analysis detailing your home's value as well as a comparison with similar homes in the area
Home Values in the Area
Average Home Value in this Area
Purchase History
| Date | Buyer | Sale Price | Title Company |
|---|---|---|---|
| Prosperity Partners Llc | -- | None Listed On Document | |
| Barker Sarah M | -- | None Available | |
| Baker Sarah M | -- | Titleone | |
| Lassiter Robert C | -- | -- |
Source: Public Records
Mortgage History
| Date | Status | Borrower | Loan Amount |
|---|---|---|---|
| Previous Owner | Baker Sarah M | $119,515 | |
| Previous Owner | Lassiter Robert C | $120,200 |
Source: Public Records
Tax History Compared to Growth
Tax History
| Year | Tax Paid | Tax Assessment Tax Assessment Total Assessment is a certain percentage of the fair market value that is determined by local assessors to be the total taxable value of land and additions on the property. | Land | Improvement |
|---|---|---|---|---|
| 2025 | $1,014 | $214,647 | $74,994 | $139,653 |
| 2024 | $1,014 | $214,647 | $74,994 | $139,653 |
| 2023 | $935 | $226,282 | $74,994 | $151,288 |
| 2022 | $1,159 | $202,501 | $51,213 | $151,288 |
| 2021 | $1,235 | $164,113 | $42,833 | $121,280 |
| 2020 | $1,019 | $133,538 | $39,778 | $93,760 |
| 2019 | $1,205 | $134,953 | $42,833 | $92,120 |
| 2018 | $1,095 | $116,964 | $29,394 | $87,570 |
| 2017 | $978 | $104,334 | $29,394 | $74,940 |
| 2016 | $941 | $93,884 | $0 | $0 |
| 2015 | $915 | $93,884 | $29,394 | $64,490 |
| 2012 | -- | $78,716 | $0 | $0 |
Source: Public Records
Map
Nearby Homes
- 1117 Valencia St
- 124 Pheasant Rd
- 1339 Washington St S
- 1348 Way
- 1329 Haizlee Way
- 1362 Haizlee Way
- 334 Pheasant Rd
- 1357 Haizlee Way
- 1376 Haizlee Way
- 1384 Jump St
- 1390 Haizlee Way
- 1385 Haizlee Way
- 1399 Haizlee Way
- 1413 Haizlee Way
- 259 Pheasant Rd W
- 259 Pheasant Rd W
- 259 Pheasant Rd W Unit 3
- 1445 Zephlyn St
- 1470 Haizlee Way
- 1459 Zephlyn St
- 176 El Camino Ave
- 123 Cordova Ave
- 133 Cordova Ave
- 169 El Camino Ave
- 146 El Camino Ave
- 186 El Camino Ave
- 159 El Camino Ave
- 179 El Camino Ave
- 147 Cordova Ave
- 1131 Inca Dr
- 189 El Camino Ave
- 157 Cordova Ave
- 138 Cordova Ave
- 152 Cordova Ave
- 112 Caliente Dr
- 124 Cordova Ave
- 124 Caliente Dr
- 1108 Inca Dr
- 199 El Camino Ave
- 130 El Camino Ave