166 Virginia Dr Ventura, CA 93003
Midtown NeighborhoodEstimated Value: $912,000 - $1,117,000
3
Beds
1
Bath
1,257
Sq Ft
$811/Sq Ft
Est. Value
About This Home
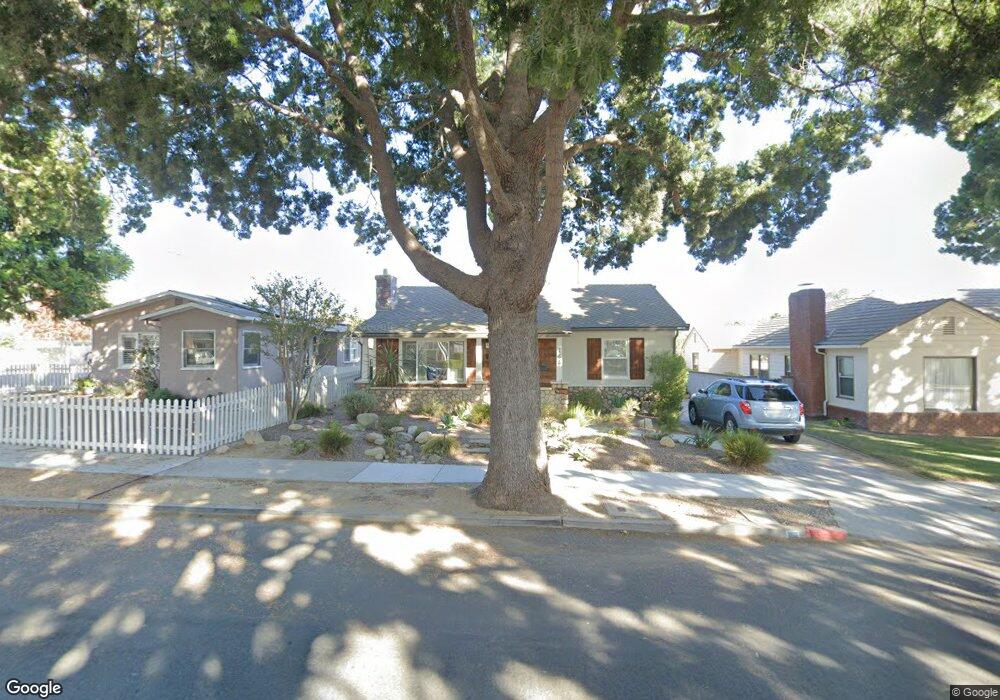
This home is located at 166 Virginia Dr, Ventura, CA 93003 and is currently estimated at $1,018,837, approximately $810 per square foot. 166 Virginia Dr is a home located in Ventura County with nearby schools including Loma Vista Elementary School, Cabrillo Middle School, and Ventura High School.
Ownership History
Date
Name
Owned For
Owner Type
Purchase Details
Closed on
Sep 28, 2005
Sold by
Good Kathleen Gail
Bought by
Good Kathleen G
Current Estimated Value
Purchase Details
Closed on
Apr 2, 2002
Sold by
Good Kathleen G
Bought by
Good Kathleen Gail
Home Financials for this Owner
Home Financials are based on the most recent Mortgage that was taken out on this home.
Original Mortgage
$144,000
Interest Rate
6.29%
Purchase Details
Closed on
Sep 16, 1996
Sold by
Daskalu Angelina L and Markou Thomas G
Bought by
Good Kathleen G
Home Financials for this Owner
Home Financials are based on the most recent Mortgage that was taken out on this home.
Original Mortgage
$146,600
Interest Rate
8.3%
Purchase Details
Closed on
Oct 12, 1993
Sold by
Daskalu Angelina Louise
Bought by
Daskalu Angelina Louise and Markou Thomas G
Create a Home Valuation Report for This Property
The Home Valuation Report is an in-depth analysis detailing your home's value as well as a comparison with similar homes in the area
Home Values in the Area
Average Home Value in this Area
Purchase History
| Date | Buyer | Sale Price | Title Company |
|---|---|---|---|
| Good Kathleen G | -- | -- | |
| Good Kathleen Gail | -- | Fidelity National Title Co | |
| Good Kathleen G | $184,000 | Fidelity National Title | |
| Daskalu Angelina Louise | -- | -- |
Source: Public Records
Mortgage History
| Date | Status | Borrower | Loan Amount |
|---|---|---|---|
| Closed | Good Kathleen Gail | $144,000 | |
| Closed | Good Kathleen G | $146,600 |
Source: Public Records
Tax History Compared to Growth
Tax History
| Year | Tax Paid | Tax Assessment Tax Assessment Total Assessment is a certain percentage of the fair market value that is determined by local assessors to be the total taxable value of land and additions on the property. | Land | Improvement |
|---|---|---|---|---|
| 2025 | $3,300 | $305,548 | $179,138 | $126,410 |
| 2024 | $3,300 | $299,557 | $175,625 | $123,932 |
| 2023 | $3,260 | $293,684 | $172,182 | $121,502 |
| 2022 | $3,038 | $287,926 | $168,806 | $119,120 |
| 2021 | $2,980 | $282,281 | $165,496 | $116,785 |
| 2020 | $2,951 | $279,389 | $163,800 | $115,589 |
| 2019 | $2,896 | $273,912 | $160,589 | $113,323 |
| 2018 | $2,848 | $268,542 | $157,441 | $111,101 |
| 2017 | $2,787 | $263,277 | $154,354 | $108,923 |
| 2016 | $2,733 | $258,116 | $151,328 | $106,788 |
| 2015 | $2,703 | $254,241 | $149,056 | $105,185 |
| 2014 | $2,659 | $249,263 | $146,137 | $103,126 |
Source: Public Records
Map
Nearby Homes
- 2542 Poli St
- 2418 Lexington Dr
- 69 S Seaward Ave
- 220 Frances St
- 344 S Evergreen Dr
- 297 Rancho Dr
- Plan D at Portalvo - Townhomes
- Plan F at Portalvo - Townhomes
- Plan E at Portalvo - Townhomes
- Plan O at Portalvo - Condos/Flats
- Plan A at Portalvo - Townhomes
- Plan H at Portalvo - Condos/Flats
- Plan L at Portalvo - Condos/Flats
- Plan C at Portalvo - Townhomes
- Plan B at Portalvo - Townhomes
- Plan J at Portalvo - Condos/Flats
- Plan G at Portalvo - Townhomes
- Plan N at Portalvo - Condos/Flats
- Plan K at Portalvo - Condos/Flats
- Plan M at Portalvo - Condos/Flats
- 2748 Lexington Dr
- 156 Virginia Dr
- 221 Dalton St
- 213 Dalton St
- 144 Virginia Dr
- 229 Dalton St
- 205 Dalton St
- 190 Virginia Dr
- 197 Dalton St
- 167 Virginia Dr
- 138 Virginia Dr
- 2696 Lexington Dr
- 159 Virginia Dr
- 196 Virginia Dr
- 2785 Lexington Dr
- 191 Dalton St
- 145 Virginia Dr
- 251 Dalton St
- 130 Virginia Dr
- 132 Virginia Dr