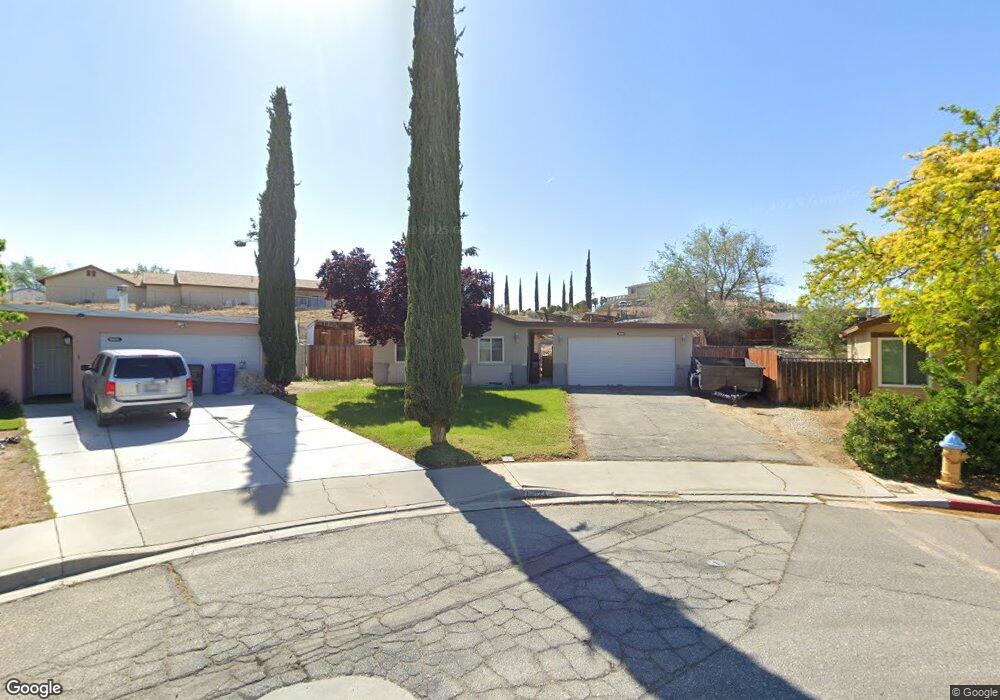
16623 Lariat Rd Victorville, CA 92395
Estimated Value: $346,869 - $362,000
4
Beds
2
Baths
1,200
Sq Ft
$295/Sq Ft
Est. Value
About This Home
This home is located at 16623 Lariat Rd, Victorville, CA 92395 and is currently estimated at $353,467, approximately $294 per square foot. 16623 Lariat Rd is a home located in San Bernardino County with nearby schools including Green Tree East Elementary School, Del Rey Elementary School, and Lakeview Leadership Academy.
Ownership History
Date
Name
Owned For
Owner Type
Purchase Details
Closed on
Nov 1, 2009
Sold by
Wiechert Richard C
Bought by
Wiechert Richard C
Current Estimated Value
Home Financials for this Owner
Home Financials are based on the most recent Mortgage that was taken out on this home.
Original Mortgage
$45,650
Outstanding Balance
$28,248
Interest Rate
4%
Mortgage Type
VA
Estimated Equity
$325,219
Purchase Details
Closed on
Jul 26, 1999
Sold by
Wiechart Dena K
Bought by
Wiechart Richard C
Purchase Details
Closed on
Nov 26, 1997
Sold by
Lunceford Olga F and Lunceford Stavroola
Bought by
Wiechert Richard and Wiechert Dena
Home Financials for this Owner
Home Financials are based on the most recent Mortgage that was taken out on this home.
Original Mortgage
$46,350
Interest Rate
6.97%
Mortgage Type
VA
Create a Home Valuation Report for This Property
The Home Valuation Report is an in-depth analysis detailing your home's value as well as a comparison with similar homes in the area
Home Values in the Area
Average Home Value in this Area
Purchase History
| Date | Buyer | Sale Price | Title Company |
|---|---|---|---|
| Wiechert Richard C | -- | First American | |
| Wiechart Richard C | -- | -- | |
| Wiechert Richard | $45,000 | Chicago Title |
Source: Public Records
Mortgage History
| Date | Status | Borrower | Loan Amount |
|---|---|---|---|
| Open | Wiechert Richard C | $45,650 | |
| Previous Owner | Wiechert Richard | $46,350 |
Source: Public Records
Tax History Compared to Growth
Tax History
| Year | Tax Paid | Tax Assessment Tax Assessment Total Assessment is a certain percentage of the fair market value that is determined by local assessors to be the total taxable value of land and additions on the property. | Land | Improvement |
|---|---|---|---|---|
| 2025 | $848 | $70,549 | $15,679 | $54,870 |
| 2024 | $848 | $69,166 | $15,372 | $53,794 |
| 2023 | $838 | $67,810 | $15,071 | $52,739 |
| 2022 | $822 | $66,480 | $14,775 | $51,705 |
| 2021 | $807 | $65,176 | $14,485 | $50,691 |
| 2020 | $792 | $64,507 | $14,336 | $50,171 |
| 2019 | $779 | $63,242 | $14,055 | $49,187 |
| 2018 | $829 | $62,002 | $13,779 | $48,223 |
| 2017 | $812 | $60,786 | $13,509 | $47,277 |
| 2016 | $796 | $59,594 | $13,244 | $46,350 |
| 2015 | $769 | $58,699 | $13,045 | $45,654 |
| 2014 | $754 | $57,549 | $12,789 | $44,760 |
Source: Public Records
Map
Nearby Homes
- 16624 Lariat Rd
- 0 Rodeo Dr
- 0 City View Dr Unit HD25142391
- 16782 Pebble Beach Ct
- 16581 Desert Sands Rd
- 16740 Pebble Beach Dr
- 14312 Hesperia Rd
- 14375 Cactus Dr
- 14385 Cactus Dr
- 13984 Victoria Dr
- 13964 Victoria Ct
- 14166 Riviera Dr
- 13991 Riviera Dr
- 16333 Molino Dr
- 0 Molino Dr Unit HD25026364
- 16340 Camelback Dr
- 0 Victoria Dr Unit IG25161150
- 14005 Victoria Dr
- 16321 Pebble Beach
- 16924 Crestview Dr
- 16615 Lariat Rd
- 16626 Lariat Rd
- 16604 Batson Rd
- 18913 Lariat Rd
- 18929 Lariat Rd
- 18919 Lariat Rd
- 16612 Batson Rd
- 16630 Batson Rd
- 16605 Lariat Rd
- 16612 Lariat Rd
- 16592 Batson Rd
- 16696 Batson Place
- 16662 Batson Rd
- 16604 Lariat Rd
- 16624 Batson Rd
- 16591 Lariat Rd
- 16635 Batson Rd
- 16582 Batson Rd
- 16626 Batson Rd
- 16592 Lariat Rd