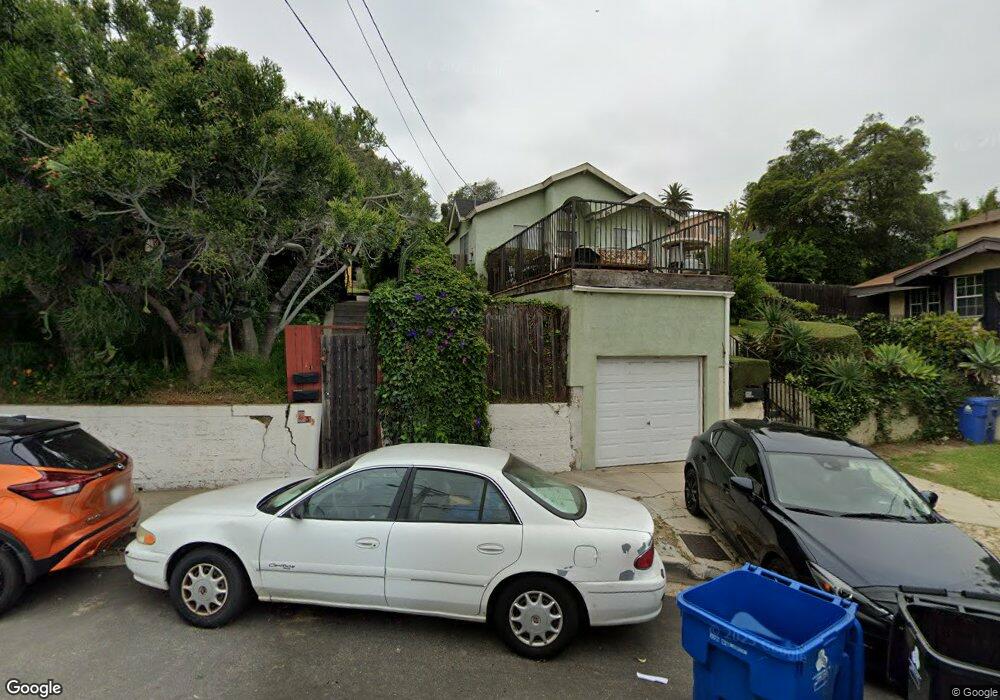
1663 Lucretia Ave Los Angeles, CA 90026
Echo Park NeighborhoodEstimated Value: $1,109,000 - $1,265,000
3
Beds
2
Baths
1,080
Sq Ft
$1,085/Sq Ft
Est. Value
About This Home
This home is located at 1663 Lucretia Ave, Los Angeles, CA 90026 and is currently estimated at $1,171,940, approximately $1,085 per square foot. 1663 Lucretia Ave is a home located in Los Angeles County with nearby schools including Elysian Heights Elementary, Thomas Starr King Middle School Film and Media Magnet, and John Marshall Senior High.
Ownership History
Date
Name
Owned For
Owner Type
Purchase Details
Closed on
Mar 31, 2025
Sold by
Toots Charles Paul
Bought by
Toots Charles Paul and Toots Nicholas Andrea
Current Estimated Value
Purchase Details
Closed on
Dec 21, 2001
Sold by
Linkey Estela
Bought by
Toots Charles Paul
Home Financials for this Owner
Home Financials are based on the most recent Mortgage that was taken out on this home.
Original Mortgage
$234,650
Interest Rate
7.17%
Purchase Details
Closed on
Jun 6, 2001
Sold by
Verdiell Vicente R
Bought by
Linkey Estela
Home Financials for this Owner
Home Financials are based on the most recent Mortgage that was taken out on this home.
Original Mortgage
$130,000
Interest Rate
7.21%
Mortgage Type
Construction
Purchase Details
Closed on
Mar 31, 1999
Sold by
Shimoguchi Maya
Bought by
Verdiell Vicente R and Veriell Manuel
Create a Home Valuation Report for This Property
The Home Valuation Report is an in-depth analysis detailing your home's value as well as a comparison with similar homes in the area
Home Values in the Area
Average Home Value in this Area
Purchase History
| Date | Buyer | Sale Price | Title Company |
|---|---|---|---|
| Toots Charles Paul | -- | None Listed On Document | |
| Toots Charles Paul | $247,000 | Equity Title | |
| Linkey Estela | $50,000 | Orange Coast Title | |
| Verdiell Vicente R | $23,000 | Orange Coast Title |
Source: Public Records
Mortgage History
| Date | Status | Borrower | Loan Amount |
|---|---|---|---|
| Previous Owner | Toots Charles Paul | $234,650 | |
| Previous Owner | Linkey Estela | $130,000 | |
| Closed | Toots Charles Paul | $1,500 |
Source: Public Records
Tax History Compared to Growth
Tax History
| Year | Tax Paid | Tax Assessment Tax Assessment Total Assessment is a certain percentage of the fair market value that is determined by local assessors to be the total taxable value of land and additions on the property. | Land | Improvement |
|---|---|---|---|---|
| 2025 | $4,467 | $364,870 | $217,150 | $147,720 |
| 2024 | $4,467 | $357,717 | $212,893 | $144,824 |
| 2023 | $4,382 | $350,704 | $208,719 | $141,985 |
| 2022 | $4,177 | $343,828 | $204,627 | $139,201 |
| 2021 | $4,123 | $337,087 | $200,615 | $136,472 |
| 2019 | $4,000 | $327,090 | $194,665 | $132,425 |
| 2018 | $3,976 | $320,678 | $190,849 | $129,829 |
| 2016 | $3,794 | $308,228 | $183,439 | $124,789 |
| 2015 | $3,739 | $303,599 | $180,684 | $122,915 |
| 2014 | $3,758 | $297,653 | $177,145 | $120,508 |
Source: Public Records
Map
Nearby Homes
- 1804 Echo Park Ave
- 1632 Echo Park Ave
- 1519 Morton Terrace
- 1941 Delta St
- 1551 Lucretia Ave
- 1721 Morton Ave
- 1937 Delta St
- 1947 Delta St
- 1625 Grafton St
- 1925 Berkeley Ave
- 1653 Bruce Ct
- 1649 Bruce Ct
- 1645 Bruce Ct
- 1633 Bruce Ct
- 1882 N Alvarado St Unit 16
- 1637 N Alvarado St
- 2126 Branden St
- 2123 Branden St
- 1956 Vestal Ave
- 1506 Glendale Blvd
- 1659 Lucretia Ave
- 1702 Lemoyne St
- 1651 Lucretia Ave
- 1706 Lemoyne St
- 1671 Lucretia Ave
- 1660 Lemoyne St
- 1710 Lemoyne St
- 1656 Lemoyne St
- 1647 Lucretia Ave
- 1645 Lucretia Ave
- 1677 Lucretia Ave
- 1650 Lemoyne St
- 1714 Lemoyne St
- 1707 Echo Park Ave
- 1646 Lemoyne St
- 1643 Lucretia Ave
- 1713 Echo Park Ave
- 1720 Lemoyne St
- 1661 Echo Park Ave Unit 4
- 1661 Echo Park Ave