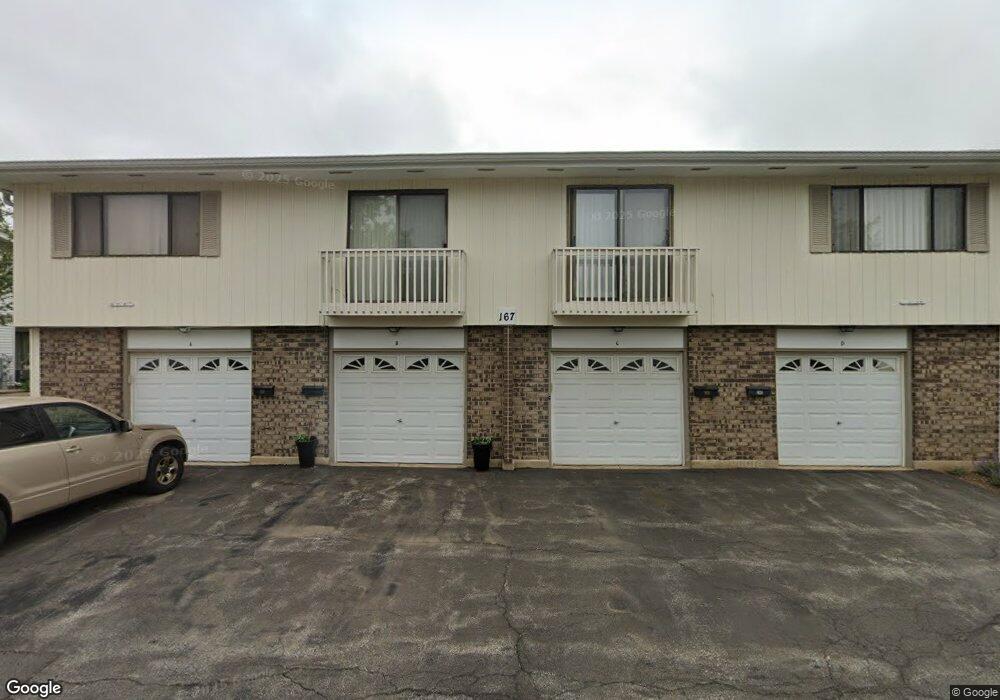
167 Quincy Ct Unit B Bloomingdale, IL 60108
Estimated Value: $221,920 - $263,000
2
Beds
1
Bath
1,004
Sq Ft
$235/Sq Ft
Est. Value
About This Home
This home is located at 167 Quincy Ct Unit B, Bloomingdale, IL 60108 and is currently estimated at $235,980, approximately $235 per square foot. 167 Quincy Ct Unit B is a home located in DuPage County with nearby schools including Dujardin Elementary School, Westfield Middle School, and Lake Park High School.
Ownership History
Date
Name
Owned For
Owner Type
Purchase Details
Closed on
May 8, 2025
Sold by
Matt Deyana
Bought by
Todd Tina R and Paprocki Kimberly R
Current Estimated Value
Purchase Details
Closed on
Nov 30, 2007
Sold by
Banks James V and Banks Heather M
Bought by
Matt Deyana
Home Financials for this Owner
Home Financials are based on the most recent Mortgage that was taken out on this home.
Original Mortgage
$125,000
Interest Rate
6.31%
Mortgage Type
Purchase Money Mortgage
Purchase Details
Closed on
Apr 1, 2003
Sold by
Fritz Lolita E
Bought by
Banks James V and Banks Heather M
Home Financials for this Owner
Home Financials are based on the most recent Mortgage that was taken out on this home.
Original Mortgage
$132,800
Interest Rate
6.75%
Mortgage Type
Purchase Money Mortgage
Purchase Details
Closed on
Oct 23, 1994
Sold by
Rowe Julie A
Bought by
Fritz Lolita E
Purchase Details
Closed on
Oct 5, 1994
Sold by
West Suburban Bank
Bought by
Rowe Julie A
Create a Home Valuation Report for This Property
The Home Valuation Report is an in-depth analysis detailing your home's value as well as a comparison with similar homes in the area
Home Values in the Area
Average Home Value in this Area
Purchase History
| Date | Buyer | Sale Price | Title Company |
|---|---|---|---|
| Todd Tina R | $220,000 | Chicago Title | |
| Matt Deyana | $167,000 | Attorneys Title Guaranty Fun | |
| Banks James V | $125,000 | Ctic Dupage | |
| Fritz Lolita E | $91,000 | -- | |
| Rowe Julie A | -- | -- |
Source: Public Records
Mortgage History
| Date | Status | Borrower | Loan Amount |
|---|---|---|---|
| Previous Owner | Matt Deyana | $125,000 | |
| Previous Owner | Banks James V | $132,800 |
Source: Public Records
Tax History Compared to Growth
Tax History
| Year | Tax Paid | Tax Assessment Tax Assessment Total Assessment is a certain percentage of the fair market value that is determined by local assessors to be the total taxable value of land and additions on the property. | Land | Improvement |
|---|---|---|---|---|
| 2024 | -- | $61,389 | $9,142 | $52,247 |
| 2023 | $4,223 | $56,140 | $8,360 | $47,780 |
| 2022 | $4,095 | $55,880 | $8,320 | $47,560 |
| 2021 | $3,949 | $53,090 | $7,900 | $45,190 |
| 2020 | $3,993 | $51,800 | $7,710 | $44,090 |
| 2019 | $3,866 | $49,780 | $7,410 | $42,370 |
| 2018 | $2,253 | $35,400 | $7,220 | $28,180 |
| 2017 | $2,106 | $32,810 | $6,690 | $26,120 |
| 2016 | $1,999 | $30,360 | $6,190 | $24,170 |
| 2015 | $1,942 | $28,330 | $5,780 | $22,550 |
| 2014 | $1,953 | $27,820 | $5,780 | $22,040 |
| 2013 | $1,943 | $28,770 | $5,980 | $22,790 |
Source: Public Records
Map
Nearby Homes
- 195 Duxbury Ct Unit D
- 120 Brewster Ct Unit D
- 135 Fairlane Ct Unit B
- 181 Lakeview Ct
- 253 Sterling Ln
- 158 S Prairie Ave
- 186 Dunteman Dr Unit 301
- 161 N Waters Edge Dr Unit 202
- 201 N Waters Edge Dr Unit 101
- 166 W Lake St
- 2257 Lake Ridge Dr Unit 74
- 148 Longridge Dr
- 169 E Lake Ridge Dr Unit 21
- 119 W Lake St
- 2158 College Dr Unit 7
- 2155 College Dr Unit 7
- 224 Oakwood Ln
- 177 Cardinal Dr
- 120 Lakeview Dr Unit 513
- 120 Lakeview Dr Unit 514
- 119 Fairlane Ct Unit 119
- 136 Fairlane Ct Unit D
- 140 Brewster Ct Unit C
- 162 Quincy Ct Unit C
- 120 Brewster Ct Unit A
- 171 Quincy Ct Unit C
- 135 Brewster Ct Unit C
- 143 Brewster Ct Unit B
- 196 Duxbury Ct Unit 291
- 131 Fairlane Ct
- 195 Duxbury Ct Unit A
- 162 Chatham Ct Unit C
- 132 Fairlane Ct Unit B
- 120 Fairlane Ct Unit A
- 120 Fairlane Ct Unit B
- 162 Quincy Ct Unit D
- 155 Chatham Ct Unit 384
- 124 Brewster Ct Unit A
- 162 Chatham Ct Unit D
- 154 Chatham Ct Unit A