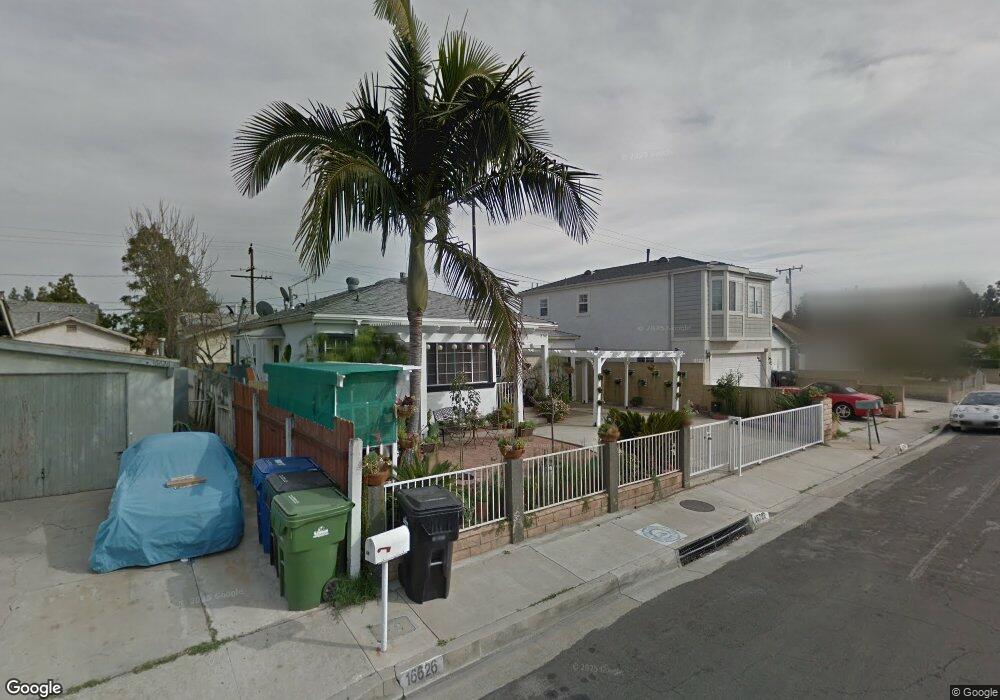
16707 Alora Ave Cerritos, CA 90703
Estimated Value: $661,000 - $847,779
3
Beds
1
Bath
986
Sq Ft
$737/Sq Ft
Est. Value
About This Home
This home is located at 16707 Alora Ave, Cerritos, CA 90703 and is currently estimated at $726,695, approximately $737 per square foot. 16707 Alora Ave is a home located in Los Angeles County with nearby schools including Niemes (John H.) Elementary School, Ross (Faye) Middle School, and Gahr High School.
Ownership History
Date
Name
Owned For
Owner Type
Purchase Details
Closed on
Nov 28, 2011
Sold by
Wells Fargo Bank N A
Bought by
Wong King W and Wong Vicky C
Current Estimated Value
Home Financials for this Owner
Home Financials are based on the most recent Mortgage that was taken out on this home.
Original Mortgage
$184,800
Outstanding Balance
$125,467
Interest Rate
3.93%
Mortgage Type
New Conventional
Estimated Equity
$601,228
Purchase Details
Closed on
Sep 23, 2011
Sold by
Stoddard John D and Stoddard Cecilia J
Bought by
Wells Fargo Bakn Na
Purchase Details
Closed on
Apr 25, 2002
Sold by
Armijo Grace A and Stoddard Cecilia J
Bought by
Stoddard John
Home Financials for this Owner
Home Financials are based on the most recent Mortgage that was taken out on this home.
Original Mortgage
$110,000
Interest Rate
7.75%
Purchase Details
Closed on
Feb 29, 1996
Sold by
Armijo Clarence F
Bought by
Armijo Clarence F and Armijo Virginia M
Create a Home Valuation Report for This Property
The Home Valuation Report is an in-depth analysis detailing your home's value as well as a comparison with similar homes in the area
Home Values in the Area
Average Home Value in this Area
Purchase History
| Date | Buyer | Sale Price | Title Company |
|---|---|---|---|
| Wong King W | $231,000 | Fidelity National Title Co | |
| Wells Fargo Bakn Na | $200,963 | Accommodation | |
| Stoddard John | -- | Ticor Title | |
| Armijo Clarence F | -- | Gateway Title Company |
Source: Public Records
Mortgage History
| Date | Status | Borrower | Loan Amount |
|---|---|---|---|
| Open | Wong King W | $184,800 | |
| Previous Owner | Stoddard John | $110,000 |
Source: Public Records
Tax History Compared to Growth
Tax History
| Year | Tax Paid | Tax Assessment Tax Assessment Total Assessment is a certain percentage of the fair market value that is determined by local assessors to be the total taxable value of land and additions on the property. | Land | Improvement |
|---|---|---|---|---|
| 2025 | $3,824 | $290,136 | $232,114 | $58,022 |
| 2024 | $3,824 | $284,448 | $227,563 | $56,885 |
| 2023 | $3,705 | $278,871 | $223,101 | $55,770 |
| 2022 | $3,648 | $273,404 | $218,727 | $54,677 |
| 2021 | $3,563 | $268,044 | $214,439 | $53,605 |
| 2020 | $3,535 | $265,297 | $212,241 | $53,056 |
| 2019 | $3,484 | $260,096 | $208,080 | $52,016 |
| 2018 | $3,193 | $254,997 | $204,000 | $50,997 |
| 2016 | $3,064 | $245,097 | $196,079 | $49,018 |
| 2015 | $3,024 | $241,416 | $193,134 | $48,282 |
| 2014 | $2,970 | $236,688 | $189,351 | $47,337 |
Source: Public Records
Map
Nearby Homes
- 16729 Alora Ave
- 11221 Beach St
- 11542 169th St
- 11603 Faculty Dr
- 11558 Dartmouth Dr
- 11710 Arkansas St Unit A
- 11710 Arkansas St Unit D
- 11676 Chesterton St
- Plan 1 at Eginhouse
- Plan 3 at Eginhouse
- Plan 2 at Eginhouse
- 11718 Arkansas St Unit C
- 11718 Arkansas St Unit E
- 17630 Mapes Ave
- 16341 Pioneer Blvd Unit 11
- 15532 Allingham Ave
- 11425 178th St
- 16644 Pioneer Blvd
- 11818 167th St
- 11838 166th St
- 16704 Eric Ave
- 16711 Alora Ave
- 16705 Alora Ave
- 16710 Eric Ave
- 16702 Eric Ave
- 16717 Alora Ave
- 16625 Alora Ave
- 16626 Eric Ave
- 16718 Eric Ave
- 16708 Alora Ave
- 16704 Alora Ave
- 16714 Alora Ave
- 16707 Eric Ave
- 16700 Alora Ave
- 16711 Eric Ave
- 16622 Eric Ave
- 16705 Eric Ave
- 16621 Alora Ave
- 16725 Alora Ave
- 16701 Eric Ave