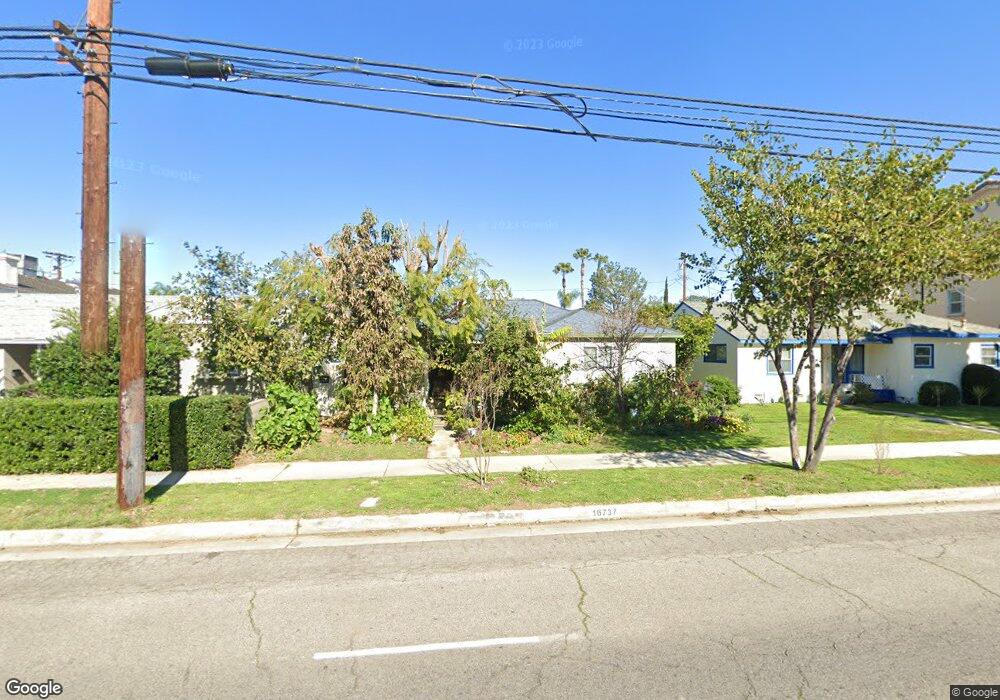
16737 Victory Blvd van Nuys, CA 91406
Estimated Value: $866,276 - $917,000
3
Beds
2
Baths
1,424
Sq Ft
$624/Sq Ft
Est. Value
About This Home
This home is located at 16737 Victory Blvd, van Nuys, CA 91406 and is currently estimated at $889,069, approximately $624 per square foot. 16737 Victory Blvd is a home located in Los Angeles County with nearby schools including Gault Street Elementary School, William Mulholland Middle, and Magnolia Science Academy 2.
Ownership History
Date
Name
Owned For
Owner Type
Purchase Details
Closed on
Jan 11, 2002
Sold by
Ayala Carlos and Ayala Rosa
Bought by
Ayala Carlos
Current Estimated Value
Home Financials for this Owner
Home Financials are based on the most recent Mortgage that was taken out on this home.
Original Mortgage
$134,810
Outstanding Balance
$54,305
Interest Rate
6.84%
Estimated Equity
$834,764
Purchase Details
Closed on
Sep 18, 1998
Sold by
Flores Jose Roberto and Ayala Oscar
Bought by
Ayala Carlos
Purchase Details
Closed on
Jun 29, 1995
Sold by
Stone Marie L
Bought by
Ayala Carlos
Home Financials for this Owner
Home Financials are based on the most recent Mortgage that was taken out on this home.
Original Mortgage
$137,750
Interest Rate
7.74%
Purchase Details
Closed on
Feb 28, 1994
Sold by
Stone Marvin
Bought by
Stone Marie L
Home Financials for this Owner
Home Financials are based on the most recent Mortgage that was taken out on this home.
Original Mortgage
$94,500
Interest Rate
6.98%
Create a Home Valuation Report for This Property
The Home Valuation Report is an in-depth analysis detailing your home's value as well as a comparison with similar homes in the area
Home Values in the Area
Average Home Value in this Area
Purchase History
| Date | Buyer | Sale Price | Title Company |
|---|---|---|---|
| Ayala Carlos | -- | Placer Title Company | |
| Ayala Carlos | -- | -- | |
| Ayala Carlos | $145,000 | First American | |
| Stone Marie L | $135,000 | First American Title Company |
Source: Public Records
Mortgage History
| Date | Status | Borrower | Loan Amount |
|---|---|---|---|
| Open | Ayala Carlos | $134,810 | |
| Previous Owner | Ayala Carlos | $137,750 | |
| Previous Owner | Stone Marie L | $94,500 |
Source: Public Records
Tax History Compared to Growth
Tax History
| Year | Tax Paid | Tax Assessment Tax Assessment Total Assessment is a certain percentage of the fair market value that is determined by local assessors to be the total taxable value of land and additions on the property. | Land | Improvement |
|---|---|---|---|---|
| 2025 | $3,645 | $271,629 | $100,535 | $171,094 |
| 2024 | $3,645 | $266,304 | $98,564 | $167,740 |
| 2023 | $3,576 | $261,083 | $96,632 | $164,451 |
| 2022 | $3,411 | $255,965 | $94,738 | $161,227 |
| 2021 | $3,361 | $250,947 | $92,881 | $158,066 |
| 2019 | $3,261 | $243,506 | $90,127 | $153,379 |
| 2018 | $3,152 | $238,732 | $88,360 | $150,372 |
| 2016 | $2,902 | $221,154 | $84,930 | $136,224 |
| 2015 | $2,959 | $217,833 | $83,655 | $134,178 |
| 2014 | $2,877 | $213,567 | $82,017 | $131,550 |
Source: Public Records
Map
Nearby Homes
- 6432 Petit Ave
- 6524 Petit Ave
- 6512 Balboa Blvd
- 6700 Balboa Blvd
- 6714 Mclennan Ave
- 6640 De Celis Place
- 6641 Gerald Ave
- 6540 Hayvenhurst Ave Unit 15
- 6540 Hayvenhurst Ave Unit 28
- 16412 Gilmore St
- 16723 Vanowen St
- 6402 Graves Ave
- 6417 Graves Ave
- 6938 Balboa Blvd
- 16820 Hart St
- 16201 Gilmore St
- 5938 Aldea Ave
- 7038 Mclennan Ave
- 6006 Babbitt Ave
- 7049 De Celis Place
- 16731 Victory Blvd
- 16741 Victory Blvd
- 16723 Victory Blvd
- 16723 Victory Blvd Unit 5
- 16723 Victory Blvd Unit 4
- 16723 Victory Blvd Unit 3
- 16723 Victory Blvd Unit 2
- 16723 Victory Blvd Unit 1
- 16736 Gilmore St
- 16730 Gilmore St
- 16751 Victory Blvd
- 16746 Gilmore St
- 6424 Whitaker Ave
- 16750 Gilmore St
- 16803 Victory Blvd
- 6430 Whitaker Ave
- 6433 Whitaker Ave
- 16802 Gilmore St
- 6430 Forbes Ave
- 6401 Petit Ave