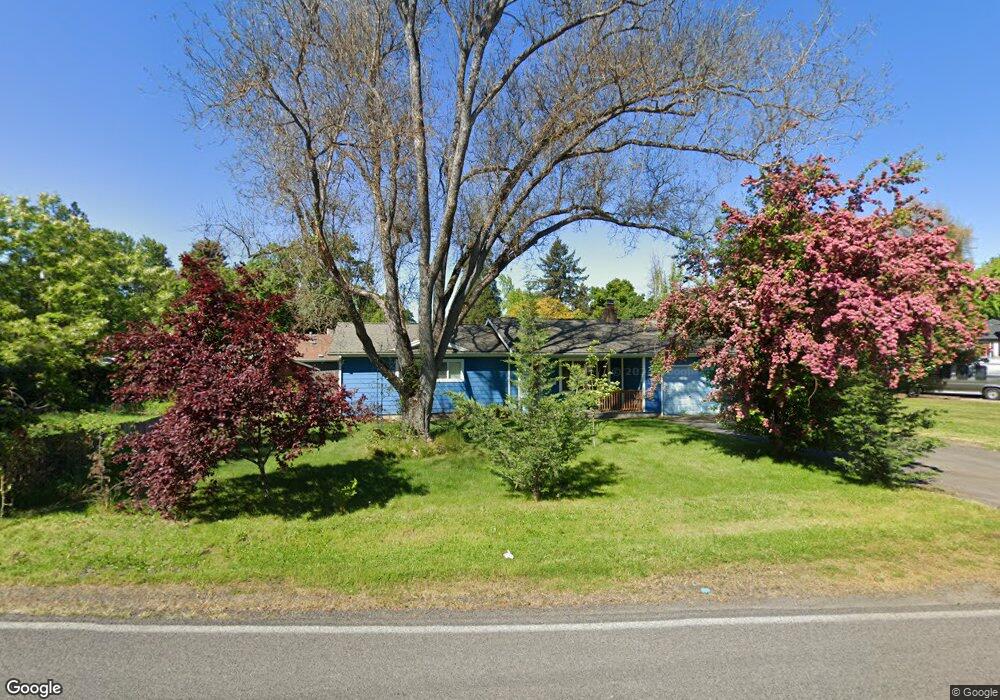
168 Highland Dr Medford, OR 97504
Estimated Value: $289,000 - $370,000
3
Beds
2
Baths
1,104
Sq Ft
$310/Sq Ft
Est. Value
About This Home
This home is located at 168 Highland Dr, Medford, OR 97504 and is currently estimated at $341,734, approximately $309 per square foot. 168 Highland Dr is a home located in Jackson County with nearby schools including Hoover Elementary School, Hedrick Middle School, and South Medford High School.
Ownership History
Date
Name
Owned For
Owner Type
Purchase Details
Closed on
Feb 2, 2018
Sold by
Shipley Douglass M and Holden Deborah L
Bought by
Holden Katherine and Haim James
Current Estimated Value
Purchase Details
Closed on
Jan 30, 2018
Sold by
Shipley Douglas M and The Deborah L Holden
Bought by
Holden Katherine and Haim James
Purchase Details
Closed on
Jul 27, 2016
Sold by
Holden Deborah L and Shipley Douglass M
Bought by
Holden Deborah L and Shipley Douglass M
Purchase Details
Closed on
Sep 14, 2001
Sold by
Wiltrout James D
Bought by
Shipley Douglass M and Holden Deborah L
Home Financials for this Owner
Home Financials are based on the most recent Mortgage that was taken out on this home.
Original Mortgage
$58,300
Interest Rate
6.99%
Create a Home Valuation Report for This Property
The Home Valuation Report is an in-depth analysis detailing your home's value as well as a comparison with similar homes in the area
Home Values in the Area
Average Home Value in this Area
Purchase History
| Date | Buyer | Sale Price | Title Company |
|---|---|---|---|
| Holden Katherine | $180,000 | First American Title | |
| Holden Katherine | $180,000 | First American Title | |
| Holden Deborah L | -- | None Available | |
| Shipley Douglass M | $114,000 | First American Title Ins Co |
Source: Public Records
Mortgage History
| Date | Status | Borrower | Loan Amount |
|---|---|---|---|
| Previous Owner | Shipley Douglass M | $58,300 |
Source: Public Records
Tax History Compared to Growth
Tax History
| Year | Tax Paid | Tax Assessment Tax Assessment Total Assessment is a certain percentage of the fair market value that is determined by local assessors to be the total taxable value of land and additions on the property. | Land | Improvement |
|---|---|---|---|---|
| 2025 | $2,734 | $188,500 | $127,840 | $60,660 |
| 2024 | $2,734 | $183,010 | $124,120 | $58,890 |
| 2023 | $2,650 | $177,680 | $120,510 | $57,170 |
| 2022 | $2,585 | $177,680 | $120,510 | $57,170 |
| 2021 | $2,519 | $172,510 | $117,010 | $55,500 |
| 2020 | $2,465 | $167,490 | $113,610 | $53,880 |
| 2019 | $2,407 | $157,890 | $107,100 | $50,790 |
| 2018 | $2,346 | $153,300 | $103,990 | $49,310 |
| 2017 | $2,303 | $153,300 | $103,990 | $49,310 |
| 2016 | $2,318 | $144,510 | $98,030 | $46,480 |
| 2015 | $2,229 | $144,510 | $98,030 | $46,480 |
| 2014 | $2,189 | $136,230 | $92,410 | $43,820 |
Source: Public Records
Map
Nearby Homes
- 149 S Keene Way Dr
- 430 Highland Dr
- 433 Highland Dr
- 341 Ardmore Ave
- 12 Glen Oak Ct
- 17 Glen Oak Ct
- 305 S Groveland Ave
- 317 Eastwood Dr
- 1711 E Main St
- 204 Mount Echo Dr
- 9 S Groveland Ave
- 1418 Appleton Cir
- 1503 E Main St
- 302 Medford Heights Ln
- 2233 Oakwood Dr
- 1279 Maple Leaf Ct Unit 1C
- 1279 Maple Leaf Ct Unit 1A
- 120 Ashland Ave
- 200 Oregon Terrace
- 101 S Modoc Ave
- 157 S Keene Way Dr
- 156 Highland Dr
- 147 S Keene Way Dr
- 157 Highland Dr
- 155 Highland Dr
- 152 Highland Dr
- 164 S Keene Way Dr
- 300 Highland Dr
- 152 S Keene Way Dr
- 143 S Keene Way Dr
- 505 Keene Dr
- 216 S Barneburg Rd
- 505 S Keene Way Dr
- 148 S Keene Way Dr
- 151 Highland Dr
- 303 Highland Dr
- 144 Highland Dr
- 214 S Barneburg Rd
- 139 S Keene Way Dr
- 324 Highland Dr