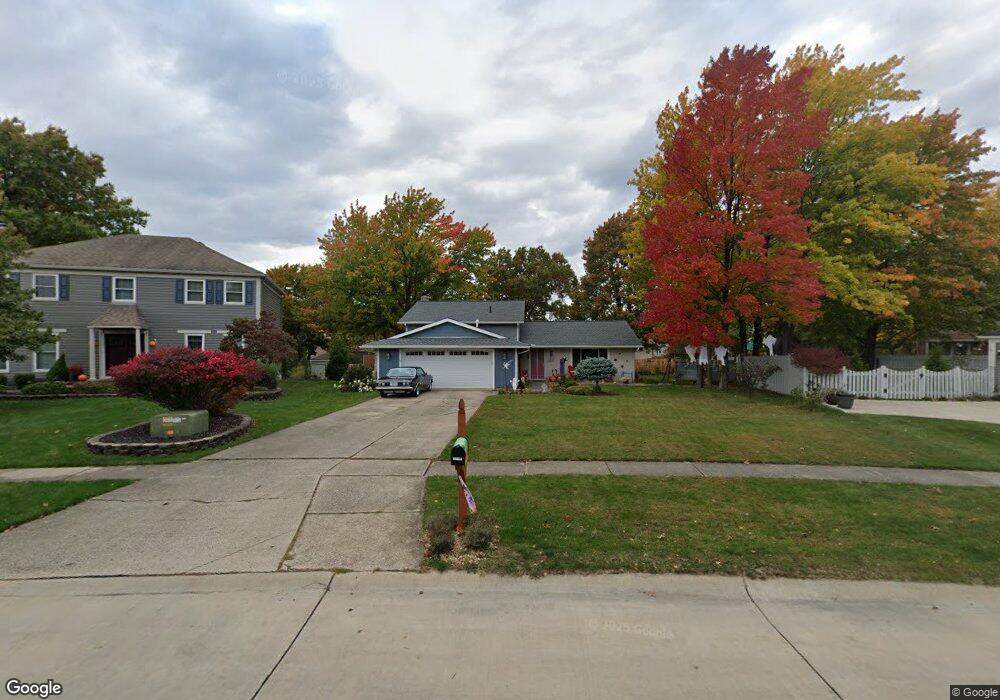
16857 Rabbit Run Dr Strongsville, OH 44136
Estimated Value: $330,392 - $376,000
3
Beds
3
Baths
2,064
Sq Ft
$170/Sq Ft
Est. Value
About This Home
This home is located at 16857 Rabbit Run Dr, Strongsville, OH 44136 and is currently estimated at $351,348, approximately $170 per square foot. 16857 Rabbit Run Dr is a home located in Cuyahoga County with nearby schools including Strongsville High School and Sts Joseph & John Interparochial School.
Ownership History
Date
Name
Owned For
Owner Type
Purchase Details
Closed on
Dec 17, 1998
Sold by
Walters Howard M and Gargalianos Patricia
Bought by
Navarra Tracy A
Current Estimated Value
Home Financials for this Owner
Home Financials are based on the most recent Mortgage that was taken out on this home.
Original Mortgage
$129,625
Outstanding Balance
$30,055
Interest Rate
7.02%
Estimated Equity
$321,293
Purchase Details
Closed on
Feb 21, 1992
Sold by
Rundo Mark and Rundo Michelle
Bought by
Walters Howard Miii
Purchase Details
Closed on
Aug 21, 1986
Sold by
Conaway Gerald D
Bought by
Rundo Mark and Rundo Michelle
Purchase Details
Closed on
Nov 17, 1976
Bought by
Conaway Gerald D
Purchase Details
Closed on
Sep 17, 1976
Bought by
John Stratford Co
Purchase Details
Closed on
Jan 1, 1976
Bought by
North East Land Co
Create a Home Valuation Report for This Property
The Home Valuation Report is an in-depth analysis detailing your home's value as well as a comparison with similar homes in the area
Home Values in the Area
Average Home Value in this Area
Purchase History
| Date | Buyer | Sale Price | Title Company |
|---|---|---|---|
| Navarra Tracy A | $152,500 | Lorain County Title Co Inc | |
| Walters Howard Miii | $116,000 | -- | |
| Rundo Mark | $61,500 | -- | |
| Conaway Gerald D | $55,000 | -- | |
| John Stratford Co | $17,000 | -- | |
| North East Land Co | -- | -- |
Source: Public Records
Mortgage History
| Date | Status | Borrower | Loan Amount |
|---|---|---|---|
| Open | Navarra Tracy A | $129,625 |
Source: Public Records
Tax History Compared to Growth
Tax History
| Year | Tax Paid | Tax Assessment Tax Assessment Total Assessment is a certain percentage of the fair market value that is determined by local assessors to be the total taxable value of land and additions on the property. | Land | Improvement |
|---|---|---|---|---|
| 2024 | $4,704 | $97,860 | $20,790 | $77,070 |
| 2023 | $4,798 | $75,010 | $17,540 | $57,470 |
| 2022 | $4,764 | $75,005 | $17,535 | $57,470 |
| 2021 | $4,731 | $75,010 | $17,540 | $57,470 |
| 2020 | $4,384 | $61,500 | $14,390 | $47,110 |
| 2019 | $4,258 | $175,700 | $41,100 | $134,600 |
| 2018 | $3,874 | $61,500 | $14,390 | $47,110 |
| 2017 | $3,863 | $56,780 | $11,590 | $45,190 |
| 2016 | $3,833 | $56,780 | $11,590 | $45,190 |
| 2015 | $3,888 | $56,780 | $11,590 | $45,190 |
| 2014 | $3,888 | $56,780 | $11,590 | $45,190 |
Source: Public Records
Map
Nearby Homes
- 18294 Drake Rd
- 17024 Bear Creek Ln
- 17934 Cambridge Oval
- 17682 Drake Rd
- 18162 Fawn Cir
- 17259 Woodshire Dr
- 18411 Yorktown Oval
- 17159 Turkey Meadow Ln
- 19297 Lauren Way
- 19311 Bradford Ct
- 16650 Lanier Ave
- 18630 Shurmer Rd
- 20393 Wildwood Ln
- 18848 Pearl Rd
- 16486 S Red Rock Dr
- 19908 Stoughton Dr
- 20114 Drake Rd
- 20121 Driftwood Ct
- 19513 Lunn Rd
- 17130 Golden Star Dr
- 16865 Rabbit Run Dr
- 16969 Stag Thicket Ln
- 16971 Stag Thicket Ln
- 16873 Rabbit Run Dr
- 16946 Deer Path Dr
- 16948 Deer Path Dr
- 16944 Deer Path Dr
- 16973 Stag Thicket Ln
- 16950 Deer Path Dr
- 16872 Rabbit Run Dr
- 16942 Deer Path Dr
- 16881 Rabbit Run Dr
- 16940 Deer Path Dr
- 17166 Rabbit Run Dr
- 16952 Stag Thicket Ln
- 16880 Rabbit Run Dr
- 16938 Deer Path Dr
- 17165 Rabbit Run Dr
- 16889 Rabbit Run Dr
- 16936 Deer Path Dr