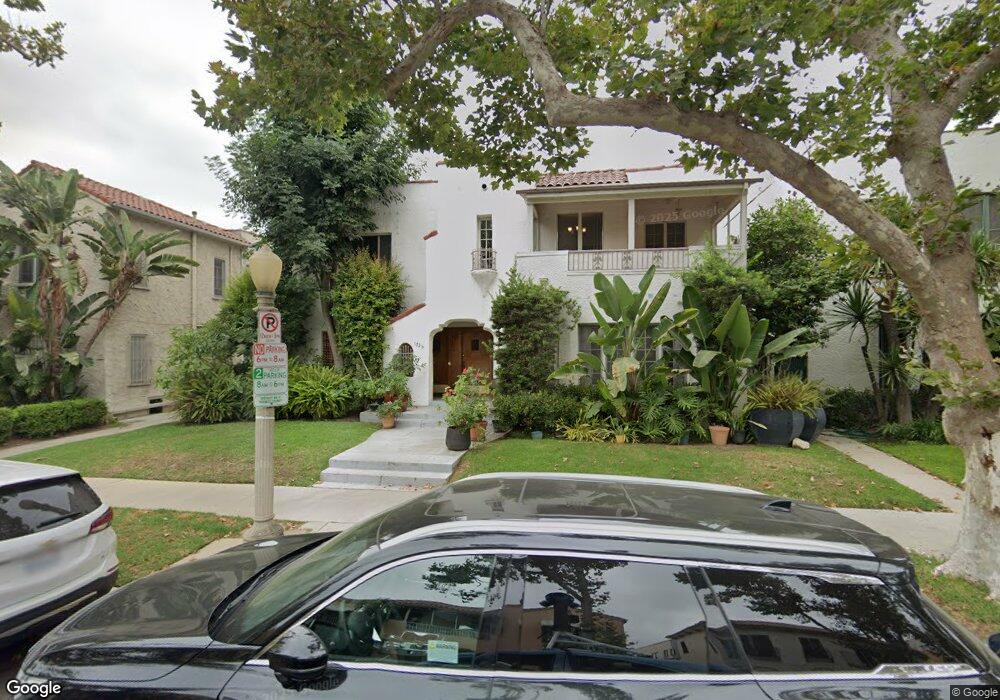
169 S Sycamore Ave Los Angeles, CA 90036
Hancock Park NeighborhoodEstimated Value: $2,316,000 - $3,270,501
8
Beds
4
Baths
5,598
Sq Ft
$480/Sq Ft
Est. Value
About This Home
This home is located at 169 S Sycamore Ave, Los Angeles, CA 90036 and is currently estimated at $2,686,875, approximately $479 per square foot. 169 S Sycamore Ave is a home located in Los Angeles County with nearby schools including Third Street Elementary School, John Burroughs Middle School, and Fairfax High School.
Ownership History
Date
Name
Owned For
Owner Type
Purchase Details
Closed on
Dec 28, 2012
Sold by
Manela Hyman
Bought by
Manela Hyman and Manela Survivors Trust
Current Estimated Value
Purchase Details
Closed on
Sep 9, 2009
Sold by
Manela Hyman
Bought by
Manela Hyman and Manela Family Trust
Purchase Details
Closed on
Jun 28, 2004
Sold by
Manela David
Bought by
Manela Hyman and Manela Francis Gertrude
Purchase Details
Closed on
Feb 24, 2003
Sold by
Kilikauskas Rom
Bought by
Manela Hyman and Manela Frances Gertrude
Purchase Details
Closed on
Jan 28, 2003
Sold by
Kilikauskas Liane
Bought by
Kilikauskas Rom
Purchase Details
Closed on
Jul 2, 2001
Sold by
Kilikauskas Rom
Bought by
Kilikauskas Rom
Purchase Details
Closed on
Jan 22, 1999
Sold by
Kilikauskas Erika
Bought by
Erika Kilikauskas Revocable Trust and Case #Bp054048
Purchase Details
Closed on
Jan 6, 1998
Sold by
Kilikauskas Erika
Bought by
Erika Kilikauskas Revocable Trust
Create a Home Valuation Report for This Property
The Home Valuation Report is an in-depth analysis detailing your home's value as well as a comparison with similar homes in the area
Home Values in the Area
Average Home Value in this Area
Purchase History
| Date | Buyer | Sale Price | Title Company |
|---|---|---|---|
| Manela Hyman | -- | None Available | |
| Manela Hyman | -- | None Available | |
| Manela Hyman | -- | None Available | |
| Manela Hyman | -- | -- | |
| Manela Hyman | $1,110,000 | Southland Title | |
| Kilikauskas Rom | -- | Southland Title | |
| Kilikauskas Rom | -- | -- | |
| Erika Kilikauskas Revocable Trust | -- | -- | |
| Erika Kilikauskas Revocable Trust | -- | -- |
Source: Public Records
Tax History Compared to Growth
Tax History
| Year | Tax Paid | Tax Assessment Tax Assessment Total Assessment is a certain percentage of the fair market value that is determined by local assessors to be the total taxable value of land and additions on the property. | Land | Improvement |
|---|---|---|---|---|
| 2025 | $19,686 | $1,607,637 | $868,994 | $738,643 |
| 2024 | $19,686 | $1,576,115 | $851,955 | $724,160 |
| 2023 | $19,314 | $1,545,211 | $835,250 | $709,961 |
| 2022 | $18,433 | $1,514,914 | $818,873 | $696,041 |
| 2021 | $18,185 | $1,485,211 | $802,817 | $682,394 |
| 2019 | $17,648 | $1,441,160 | $779,006 | $662,154 |
| 2018 | $17,501 | $1,412,903 | $763,732 | $649,171 |
| 2016 | $16,705 | $1,358,040 | $734,076 | $623,964 |
| 2015 | $16,464 | $1,337,642 | $723,050 | $614,592 |
| 2014 | $16,534 | $1,311,440 | $708,887 | $602,553 |
Source: Public Records
Map
Nearby Homes
- 109 N Sycamore Ave Unit 102
- 183 S Detroit St
- 203 S Detroit St Unit 201
- 120 N Orange Dr
- 143 N Sycamore Ave
- 147 N Detroit St
- 143 S Highland Ave
- 160 S Poinsettia Place
- 348 S Orange Dr
- 358 S Sycamore Ave
- 172 S Mccadden Place
- 101 S Fuller Ave
- 157 N Las Palmas Ave
- 420 N Orange Dr
- 452 S Sycamore Ave
- 601 S La Brea Ave
- 434 N Mansfield Ave
- 600 S Orange Dr
- 614 S Orange Dr
- 191 S Hudson Ave
- 177 S Sycamore Ave
- 163 S Sycamore Ave
- 181 S Sycamore Ave Unit 201
- 181 S Sycamore Ave Unit 102
- 181 S Sycamore Ave Unit 101
- 157 S Sycamore Ave
- 159 S Sycamore Ave
- 172 S Sycamore Ave
- 106 S Sycamore Ave
- 151 S Sycamore Ave
- 168 S Sycamore Ave
- 162 S Sycamore Ave Unit 162 1/2
- 162 S Sycamore Ave
- 160 S Sycamore Ave
- 156 S Sycamore Ave
- 180 S Sycamore Ave Unit 202
- 180 S Sycamore Ave Unit 104
- 180 S Sycamore Ave
- 145 S Sycamore Ave Unit 147
- 145 S Sycamore Ave