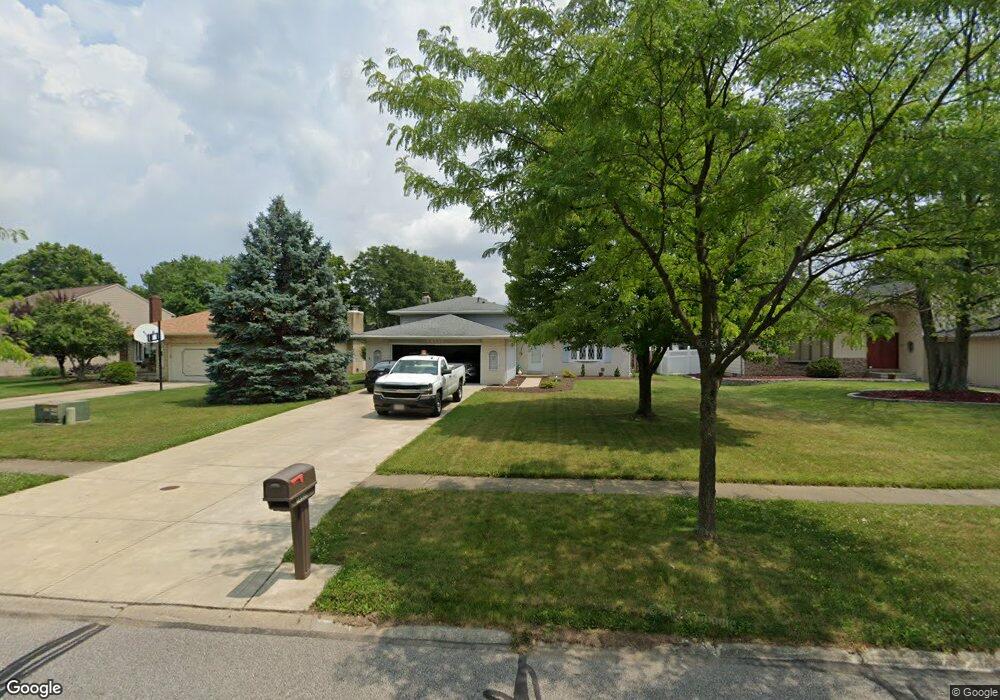
16938 Deer Path Dr Strongsville, OH 44136
Estimated Value: $348,169 - $380,000
3
Beds
3
Baths
2,208
Sq Ft
$167/Sq Ft
Est. Value
About This Home
This home is located at 16938 Deer Path Dr, Strongsville, OH 44136 and is currently estimated at $369,042, approximately $167 per square foot. 16938 Deer Path Dr is a home located in Cuyahoga County with nearby schools including Strongsville High School and Sts Joseph & John Interparochial School.
Ownership History
Date
Name
Owned For
Owner Type
Purchase Details
Closed on
Aug 13, 2002
Sold by
Copenhaer Lawrence F and Copenhaver Joy M
Bought by
Johnson Kenneth P and Johnson Tiffany D
Current Estimated Value
Home Financials for this Owner
Home Financials are based on the most recent Mortgage that was taken out on this home.
Original Mortgage
$195,597
Outstanding Balance
$83,299
Interest Rate
6.64%
Mortgage Type
VA
Estimated Equity
$285,743
Purchase Details
Closed on
Aug 12, 1983
Sold by
Copenhaver Lawrence F
Bought by
Copenhaver Lawrence F
Purchase Details
Closed on
Apr 21, 1981
Sold by
Merrill Lynch Relocation
Bought by
Copenhaver Lawrence F
Purchase Details
Closed on
Apr 11, 1977
Bought by
Bochnovich Michael L
Purchase Details
Closed on
Apr 15, 1976
Bought by
H & R Mason Contractor Inc
Purchase Details
Closed on
Jan 1, 1976
Bought by
Erie Shores Dev Co Inc
Create a Home Valuation Report for This Property
The Home Valuation Report is an in-depth analysis detailing your home's value as well as a comparison with similar homes in the area
Home Values in the Area
Average Home Value in this Area
Purchase History
| Date | Buyer | Sale Price | Title Company |
|---|---|---|---|
| Johnson Kenneth P | $189,900 | Enterprise Title | |
| Copenhaver Lawrence F | -- | -- | |
| Copenhaver Lawrence F | $85,000 | -- | |
| Merrill Lynch Relocation | -- | -- | |
| Bochnovich Michael L | $64,500 | -- | |
| H & R Mason Contractor Inc | $18,000 | -- | |
| Erie Shores Dev Co Inc | -- | -- |
Source: Public Records
Mortgage History
| Date | Status | Borrower | Loan Amount |
|---|---|---|---|
| Open | Johnson Kenneth P | $195,597 |
Source: Public Records
Tax History Compared to Growth
Tax History
| Year | Tax Paid | Tax Assessment Tax Assessment Total Assessment is a certain percentage of the fair market value that is determined by local assessors to be the total taxable value of land and additions on the property. | Land | Improvement |
|---|---|---|---|---|
| 2024 | $5,060 | $107,765 | $21,910 | $85,855 |
| 2023 | $5,207 | $83,160 | $18,480 | $64,680 |
| 2022 | $5,169 | $83,160 | $18,480 | $64,680 |
| 2021 | $5,128 | $83,160 | $18,480 | $64,680 |
| 2020 | $4,754 | $68,180 | $15,160 | $53,030 |
| 2019 | $4,614 | $194,800 | $43,300 | $151,500 |
| 2018 | $4,174 | $68,180 | $15,160 | $53,030 |
| 2017 | $4,238 | $63,880 | $12,180 | $51,700 |
| 2016 | $4,203 | $63,880 | $12,180 | $51,700 |
| 2015 | $4,263 | $63,880 | $12,180 | $51,700 |
| 2014 | $4,263 | $63,880 | $12,180 | $51,700 |
Source: Public Records
Map
Nearby Homes
- 18294 Drake Rd
- 17024 Bear Creek Ln
- 17934 Cambridge Oval
- 17682 Drake Rd
- 18162 Fawn Cir
- 18411 Yorktown Oval
- 17259 Woodshire Dr
- 17159 Turkey Meadow Ln
- 19297 Lauren Way
- 19311 Bradford Ct
- 16650 Lanier Ave
- 20393 Wildwood Ln
- 18630 Shurmer Rd
- 18848 Pearl Rd
- 16486 S Red Rock Dr
- 19908 Stoughton Dr
- 20114 Drake Rd
- 20121 Driftwood Ct
- 17130 Golden Star Dr
- 16450 Howe Rd
- 16940 Deer Path Dr
- 16936 Deer Path Dr
- 16942 Deer Path Dr
- 16934 Deer Path Dr
- 16873 Rabbit Run Dr
- 16881 Rabbit Run Dr
- 16944 Deer Path Dr
- 16865 Rabbit Run Dr
- 16889 Rabbit Run Dr
- 16932 Deer Path Dr
- 16943 Deer Path Dr
- 16945 Deer Path Dr
- 16947 Deer Path Dr
- 16941 Deer Path Dr
- 16946 Deer Path Dr
- 16897 Rabbit Run Dr
- 16857 Rabbit Run Dr
- 16949 Deer Path Dr
- 16930 Deer Path Dr
- 16939 Deer Path Dr