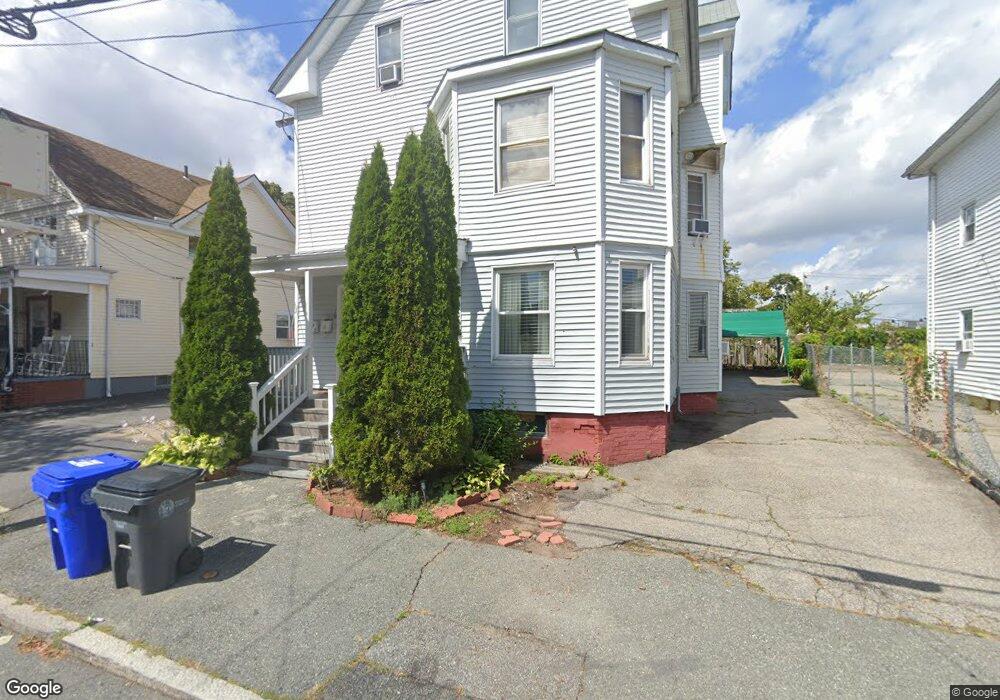
17 Babcock St Providence, RI 02905
Washington Park NeighborhoodEstimated Value: $296,898 - $632,000
6
Beds
3
Baths
3,123
Sq Ft
$165/Sq Ft
Est. Value
About This Home
This home is located at 17 Babcock St, Providence, RI 02905 and is currently estimated at $515,975, approximately $165 per square foot. 17 Babcock St is a home located in Providence County with nearby schools including Asa Messer Elementary School, Charles N. Fortes Elementary School, and Alan Shawn Feinstein Elementary.
Ownership History
Date
Name
Owned For
Owner Type
Purchase Details
Closed on
Jan 28, 2011
Sold by
Morel Belquis
Bought by
Valiente Dagoberto
Current Estimated Value
Purchase Details
Closed on
Oct 18, 2004
Sold by
Rivera Maria Pabon
Bought by
Valiente Dagoberto
Home Financials for this Owner
Home Financials are based on the most recent Mortgage that was taken out on this home.
Original Mortgage
$152,000
Interest Rate
5.8%
Mortgage Type
Purchase Money Mortgage
Purchase Details
Closed on
Mar 21, 1997
Sold by
Guzman Julio C and Guzman Margarita
Bought by
Pena Elvis and Rivera Maria P
Home Financials for this Owner
Home Financials are based on the most recent Mortgage that was taken out on this home.
Original Mortgage
$70,400
Interest Rate
7.68%
Mortgage Type
Purchase Money Mortgage
Create a Home Valuation Report for This Property
The Home Valuation Report is an in-depth analysis detailing your home's value as well as a comparison with similar homes in the area
Home Values in the Area
Average Home Value in this Area
Purchase History
| Date | Buyer | Sale Price | Title Company |
|---|---|---|---|
| Valiente Dagoberto | -- | -- | |
| Valiente Dagoberto | $160,000 | -- | |
| Pena Elvis | $88,000 | -- |
Source: Public Records
Mortgage History
| Date | Status | Borrower | Loan Amount |
|---|---|---|---|
| Previous Owner | Pena Elvis | $152,000 | |
| Previous Owner | Pena Elvis | $70,400 |
Source: Public Records
Tax History Compared to Growth
Tax History
| Year | Tax Paid | Tax Assessment Tax Assessment Total Assessment is a certain percentage of the fair market value that is determined by local assessors to be the total taxable value of land and additions on the property. | Land | Improvement |
|---|---|---|---|---|
| 2025 | $6,993 | $499,500 | $119,600 | $379,900 |
| 2024 | $6,061 | $330,300 | $75,700 | $254,600 |
| 2023 | $6,061 | $330,300 | $75,700 | $254,600 |
| 2022 | $5,879 | $330,300 | $75,700 | $254,600 |
| 2021 | $4,801 | $195,500 | $33,400 | $162,100 |
| 2020 | $4,801 | $195,500 | $33,400 | $162,100 |
| 2019 | $4,801 | $195,500 | $33,400 | $162,100 |
| 2018 | $3,931 | $123,000 | $30,400 | $92,600 |
| 2017 | $3,931 | $123,000 | $30,400 | $92,600 |
| 2016 | $3,931 | $123,000 | $30,400 | $92,600 |
| 2015 | $3,588 | $108,400 | $30,400 | $78,000 |
| 2014 | $3,659 | $108,400 | $30,400 | $78,000 |
| 2013 | $3,659 | $108,400 | $30,400 | $78,000 |
Source: Public Records
Map
Nearby Homes