Estimated Value: $1,392,000 - $2,008,102
9
Beds
3
Baths
6,190
Sq Ft
$275/Sq Ft
Est. Value
About This Home
This home is located at 17 Brookhaven Dr, Allen, TX 75002 and is currently estimated at $1,700,051, approximately $274 per square foot. 17 Brookhaven Dr is a home located in Collin County with nearby schools including Martha Hunt Elementary School, Murphy Middle School, and C A Mcmillen High School.
Ownership History
Date
Name
Owned For
Owner Type
Purchase Details
Closed on
Sep 27, 2019
Sold by
Sweet Douglas P and Sweet Mary K
Bought by
Ford Dan E and Ford Kimberly Hunter
Current Estimated Value
Purchase Details
Closed on
Oct 25, 2017
Sold by
Sweet Douglas P and Sweet Mary K
Bought by
Sweet Family Trust Inc
Purchase Details
Closed on
Apr 18, 2016
Sold by
Sweet Jack D and Sweet Margaret D
Bought by
Sweet Gregory J and Sweet Douglas P
Purchase Details
Closed on
Oct 10, 2007
Sold by
Sweet Laurie L
Bought by
Sweet Douglas P
Purchase Details
Closed on
Feb 24, 1994
Sold by
Crandell James E and Crandell Nancy J
Bought by
Thompson Kevin Ray and Thompson Dorothy A
Home Financials for this Owner
Home Financials are based on the most recent Mortgage that was taken out on this home.
Original Mortgage
$17,500
Interest Rate
6.94%
Purchase Details
Closed on
Oct 30, 1993
Sold by
Sweet Cynthia Susan
Bought by
Sweet Douglas P
Create a Home Valuation Report for This Property
The Home Valuation Report is an in-depth analysis detailing your home's value as well as a comparison with similar homes in the area
Home Values in the Area
Average Home Value in this Area
Purchase History
| Date | Buyer | Sale Price | Title Company |
|---|---|---|---|
| Ford Dan E | -- | None Available | |
| Sweet Family Trust Inc | -- | None Available | |
| Sweet Gregory J | -- | None Available | |
| Sweet Douglas P | -- | None Available | |
| Thompson Kevin Ray | -- | -- | |
| Sweet Douglas P | -- | -- |
Source: Public Records
Mortgage History
| Date | Status | Borrower | Loan Amount |
|---|---|---|---|
| Previous Owner | Thompson Kevin Ray | $17,500 | |
| Closed | Ford Dan E | $0 |
Source: Public Records
Tax History Compared to Growth
Tax History
| Year | Tax Paid | Tax Assessment Tax Assessment Total Assessment is a certain percentage of the fair market value that is determined by local assessors to be the total taxable value of land and additions on the property. | Land | Improvement |
|---|---|---|---|---|
| 2025 | $10,269 | $654,703 | $231,428 | $423,275 |
| 2024 | $10,269 | $686,496 | $175,395 | $563,141 |
| 2023 | $10,269 | $624,144 | $140,416 | $483,728 |
| 2022 | $10,370 | $524,739 | $75,428 | $491,401 |
| 2021 | $7,914 | $660,000 | $338,000 | $322,000 |
| 2020 | $6,350 | $550,000 | $312,000 | $238,000 |
| 2019 | $8,036 | $359,515 | $0 | $0 |
| 2018 | $7,387 | $326,878 | $0 | $0 |
| 2017 | $6,717 | $646,579 | $0 | $0 |
| 2016 | $6,154 | $533,104 | $0 | $0 |
| 2015 | $4,592 | $517,076 | $0 | $0 |
Source: Public Records
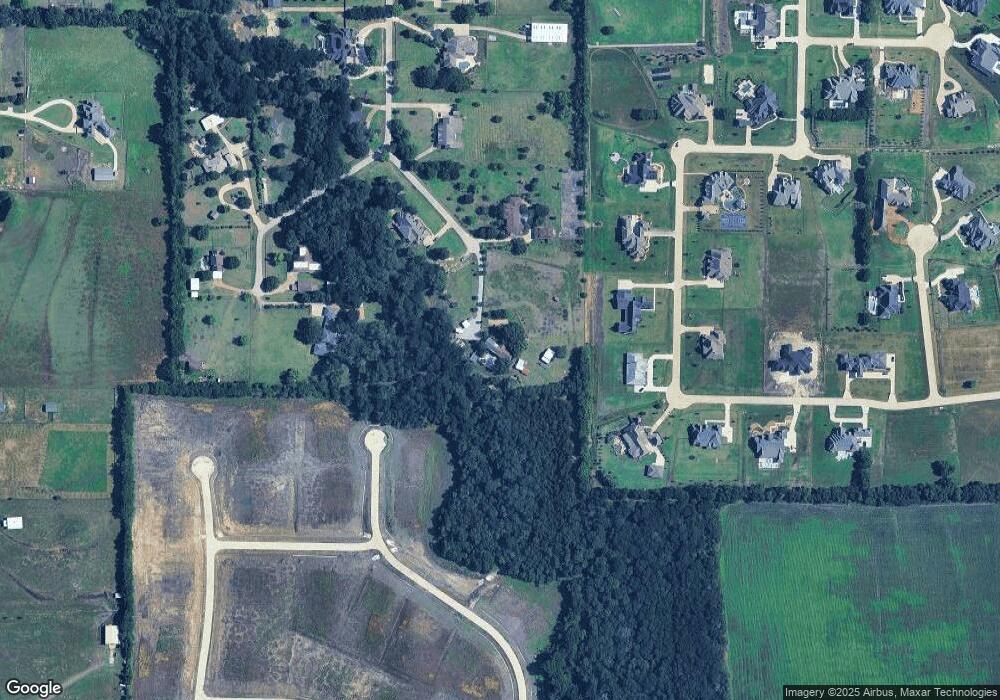
Map
Nearby Homes
- 270 Cottar Dr
- 14 Brookhaven Dr
- 201 Cottar Dr
- 121 Cottar Dr
- 725 Chapel Ct
- 303 Riva Ridge
- 23 Santa Monica Cir
- 835 Bentwater Dr
- 198 Alexander Ct
- 1479 Dean Meadow Ln
- 1319 Dean Meadow Ln
- 208 Camino Real W
- 901 Inverness Ct
- Plan D00262 at Dean Farms
- Plan D00240 at Dean Farms
- Plan D00272 at Dean Farms
- Plan D00216 at Dean Farms
- Plan D00248 at Dean Farms
- 1332 Dean Meadow Ln
- 205 Carriage Trail
- 19 Brookhaven Dr
- 15 Brookhaven Dr
- 800 Kenwood Trail
- 790 Kenwood Trail
- 24 Brookhaven Dr
- 810 Kenwood Trail
- 780 Kenwood Trail
- 26 Brookhaven Dr
- 770 Kenwood Trail
- 770 Kenwood Trail
- 805 Kenwood Trail
- 820 Kenwood Trail
- 820 Kenwood Trail
- 775 Kenwood Trail
- 18 Brookhaven Dr
- 765 Kenwood Trail
- 22 Brookhaven Dr
- 11 Brookhaven Dr
- 835 Kenwood Trail
- 830 Kenwood Trail