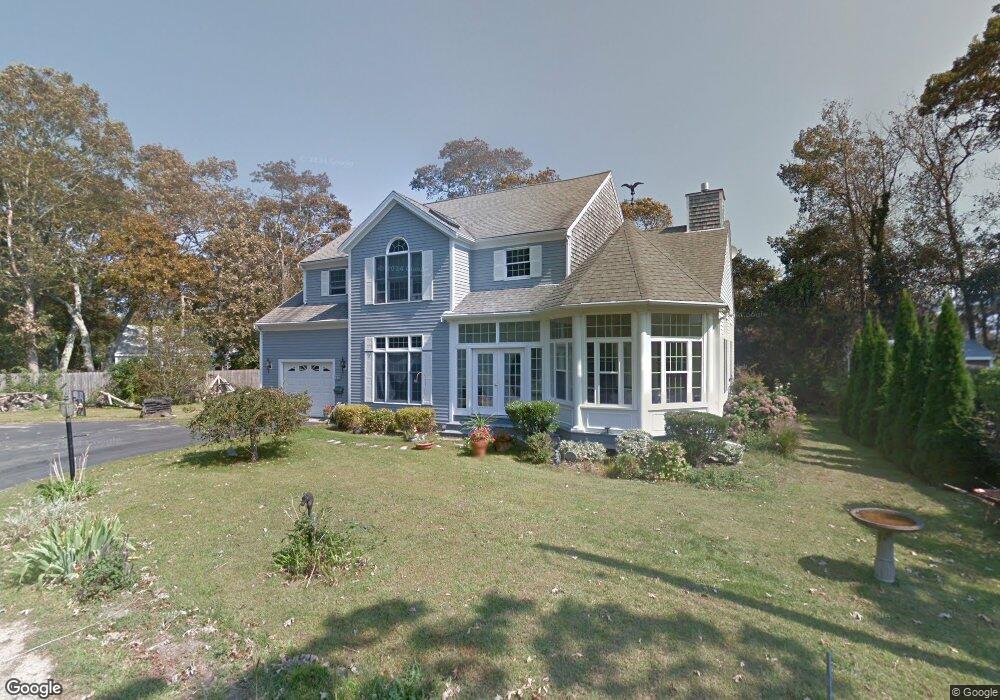
17 Dartmouth Ct Falmouth, MA 02540
Falmouth Village NeighborhoodEstimated Value: $1,455,000 - $1,704,000
3
Beds
3
Baths
2,620
Sq Ft
$599/Sq Ft
Est. Value
About This Home
This home is located at 17 Dartmouth Ct, Falmouth, MA 02540 and is currently estimated at $1,569,656, approximately $599 per square foot. 17 Dartmouth Ct is a home located in Barnstable County with nearby schools including Mullen-Hall School, Morse Pond School, and Lawrence School.
Ownership History
Date
Name
Owned For
Owner Type
Purchase Details
Closed on
Jul 13, 2023
Sold by
17 Dartmouth Ct Irt and Morrone
Bought by
Morrone James C
Current Estimated Value
Purchase Details
Closed on
Sep 2, 2021
Sold by
Morone James J
Bought by
17 Dartmouth Court Irt and Morrone
Purchase Details
Closed on
Feb 12, 2019
Sold by
Morrone James C
Bought by
Morrone James J
Purchase Details
Closed on
Jan 19, 2018
Sold by
Morrone James C
Bought by
Morrone Irt and Morrone
Purchase Details
Closed on
Sep 14, 2016
Sold by
Morone James J
Bought by
Morrone James C
Purchase Details
Closed on
Apr 25, 2016
Sold by
Morone Shirley A and Morone James J
Bought by
Morone James J
Create a Home Valuation Report for This Property
The Home Valuation Report is an in-depth analysis detailing your home's value as well as a comparison with similar homes in the area
Home Values in the Area
Average Home Value in this Area
Purchase History
| Date | Buyer | Sale Price | Title Company |
|---|---|---|---|
| Morrone James C | -- | None Available | |
| Morrone James C | -- | None Available | |
| 17 Dartmouth Court Irt | -- | None Available | |
| 17 Dartmouth Court Irt | -- | None Available | |
| Morrone James J | -- | -- | |
| Morrone James J | -- | -- | |
| Morrone James C | -- | -- | |
| Morrone James C | -- | -- | |
| Morrone Irt | -- | -- | |
| Morrone Irt | -- | -- | |
| Morrone James C | -- | -- | |
| Morrone James C | -- | -- | |
| Morone James J | -- | -- | |
| Morone James J | -- | -- | |
| Morone James J | -- | -- | |
| Morone James J | -- | -- | |
| Morone James J | -- | -- | |
| Morone James J | -- | -- | |
| Morone Shirley A | -- | -- | |
| Morone Shirley A | -- | -- |
Source: Public Records
Tax History Compared to Growth
Tax History
| Year | Tax Paid | Tax Assessment Tax Assessment Total Assessment is a certain percentage of the fair market value that is determined by local assessors to be the total taxable value of land and additions on the property. | Land | Improvement |
|---|---|---|---|---|
| 2025 | $6,672 | $1,136,700 | $489,600 | $647,100 |
| 2024 | $6,715 | $1,069,300 | $468,000 | $601,300 |
| 2023 | $5,667 | $818,900 | $350,000 | $468,900 |
| 2022 | $6,079 | $755,200 | $349,500 | $405,700 |
| 2021 | $5,755 | $677,100 | $334,300 | $342,800 |
| 2020 | $5,555 | $646,700 | $303,900 | $342,800 |
| 2019 | $5,510 | $643,700 | $303,900 | $339,800 |
| 2018 | $5,449 | $633,600 | $303,900 | $329,700 |
| 2017 | $5,335 | $625,400 | $303,900 | $321,500 |
| 2016 | $5,235 | $625,400 | $303,900 | $321,500 |
| 2015 | $5,122 | $625,400 | $303,900 | $321,500 |
| 2014 | $4,983 | $611,400 | $303,900 | $307,500 |
Source: Public Records
Map
Nearby Homes
- 200 Grand Ave
- 29 Miami Ave
- 55 Jericho Path
- 286 Grand Ave Unit 6
- 286 Grand Ave Unit 8
- 286 Grand Ave Unit 4
- 61 Menauhant Rd
- 27 Sycamore St
- 22 Alma Rd
- 9 Fairmount Ave Unit 1
- 9 Fairmount Ave
- 253 Scranton Ave
- 65 Cypress St
- 106 Beach St
- 214 Menauhant Rd
- Lot 2 Pine Grove Ave
- 480 Main St Unit 1
- 110 Dillingham Ave Unit 322
- 13 Dartmouth Ct
- 129 Jericho Path
- 135 Jericho Path
- 16 Dartmouth Ct
- 27 Hawthorne Ct
- 127 Jericho Path
- 21 Hawthorne Ct
- 9 Dartmouth Ct
- 15 Hawthorne Ct
- 141 Jericho Path
- 123 Jericho Path
- 8 Dartmouth Ct
- 8 Dartmouth Ct
- 11 Hawthorne Ct
- 153 Jericho Path Unit 10
- 153 Jericho Path Unit 9
- 153 Jericho Path Unit 8
- 153 Jericho Path Unit 7
- 153 Jericho Path Unit 6
- 153 Jericho Path Unit 5