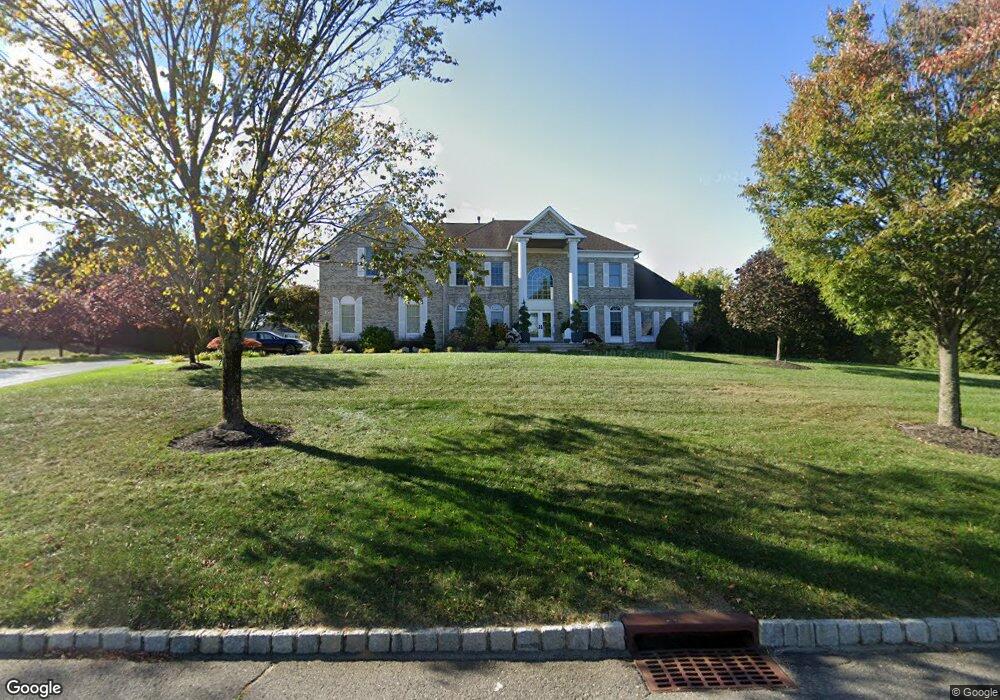
17 Equinox Ln Freehold, NJ 07728
Georgia NeighborhoodEstimated Value: $1,480,000 - $1,760,000
5
Beds
3
Baths
4,491
Sq Ft
$355/Sq Ft
Est. Value
About This Home
This home is located at 17 Equinox Ln, Freehold, NJ 07728 and is currently estimated at $1,593,398, approximately $354 per square foot. 17 Equinox Ln is a home located in Monmouth County with nearby schools including West Freehold Elementary School, Clifton T. Barkalow Middle School, and Freehold Township High School.
Ownership History
Date
Name
Owned For
Owner Type
Purchase Details
Closed on
Apr 4, 2016
Sold by
Monsorno Joseph and Monsorno Eileen A
Bought by
Turner Alan and Cohen-Horowitz Sheryl
Current Estimated Value
Purchase Details
Closed on
Oct 22, 2004
Sold by
Toll Nj Lp
Bought by
Monsorno Josep and Monsorno Eileen
Home Financials for this Owner
Home Financials are based on the most recent Mortgage that was taken out on this home.
Original Mortgage
$140,000
Interest Rate
5.75%
Create a Home Valuation Report for This Property
The Home Valuation Report is an in-depth analysis detailing your home's value as well as a comparison with similar homes in the area
Home Values in the Area
Average Home Value in this Area
Purchase History
| Date | Buyer | Sale Price | Title Company |
|---|---|---|---|
| Turner Alan | $875,000 | Title Insurance Commitment | |
| Monsorno Josep | $779,692 | -- |
Source: Public Records
Mortgage History
| Date | Status | Borrower | Loan Amount |
|---|---|---|---|
| Previous Owner | Monsorno Josep | $140,000 |
Source: Public Records
Tax History Compared to Growth
Tax History
| Year | Tax Paid | Tax Assessment Tax Assessment Total Assessment is a certain percentage of the fair market value that is determined by local assessors to be the total taxable value of land and additions on the property. | Land | Improvement |
|---|---|---|---|---|
| 2025 | $23,018 | $1,432,200 | $467,000 | $965,200 |
| 2024 | $22,674 | $1,271,700 | $351,700 | $920,000 |
| 2023 | $22,674 | $1,216,400 | $366,500 | $849,900 |
| 2022 | $19,568 | $1,035,400 | $218,000 | $817,400 |
| 2021 | $19,568 | $908,500 | $148,700 | $759,800 |
| 2020 | $19,220 | $885,700 | $138,800 | $746,900 |
| 2019 | $19,602 | $897,100 | $138,800 | $758,300 |
| 2018 | $19,338 | $865,600 | $138,800 | $726,800 |
| 2017 | $19,322 | $851,200 | $138,800 | $712,400 |
| 2016 | $20,008 | $850,000 | $163,600 | $686,400 |
| 2015 | $19,526 | $852,300 | $163,600 | $688,700 |
| 2014 | $19,967 | $835,800 | $164,700 | $671,100 |
Source: Public Records
Map
Nearby Homes