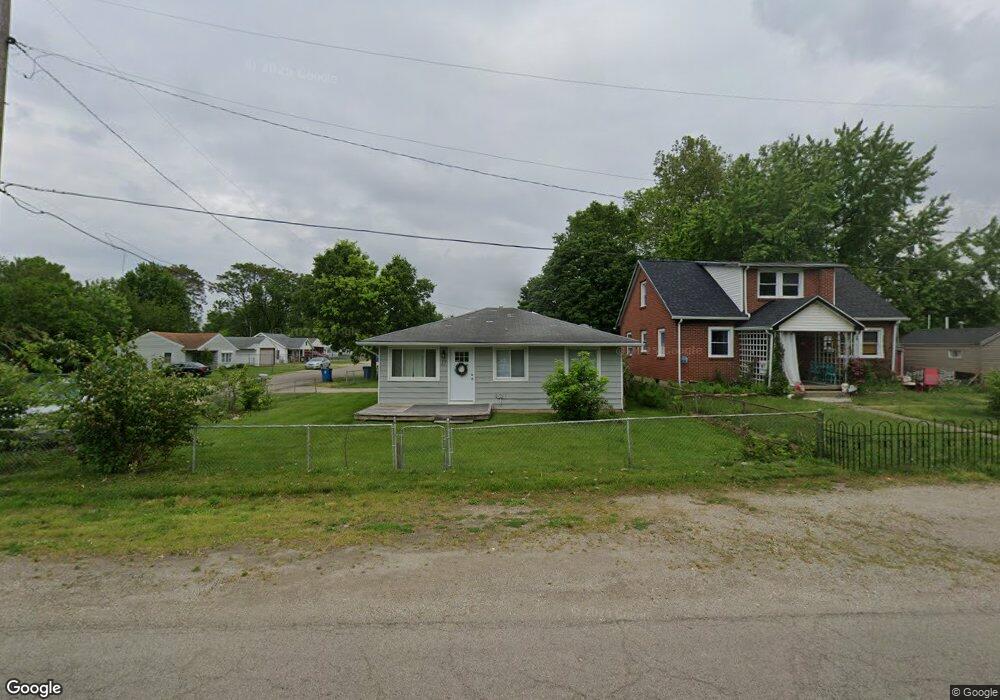
17 Prince Albert Blvd Dayton, OH 45404
Avondale NeighborhoodEstimated Value: $80,750 - $110,000
3
Beds
1
Bath
780
Sq Ft
$120/Sq Ft
Est. Value
About This Home
This home is located at 17 Prince Albert Blvd, Dayton, OH 45404 and is currently estimated at $93,438, approximately $119 per square foot. 17 Prince Albert Blvd is a home located in Montgomery County with nearby schools including Stebbins High School, Pathway School of Discovery, and Horizon Science Academy Dayton Downtown.
Ownership History
Date
Name
Owned For
Owner Type
Purchase Details
Closed on
Apr 17, 2025
Sold by
Campbell Reed and Campbell Lydia Ruth
Bought by
Campbell Legacy Properties Llc
Current Estimated Value
Purchase Details
Closed on
Jun 20, 2018
Sold by
Us Bank Na
Bought by
Campbell Reed and Campbell Lydia Ruth
Purchase Details
Closed on
Nov 20, 2017
Sold by
Wilkins Betty and Wilkins Betty L
Bought by
U S Bank Na and The 2004 Mastr Asset Backed Securities T
Purchase Details
Closed on
Jul 31, 2015
Sold by
Estate Of David E Emmons Sr
Bought by
Wilkens Betty and Wilkins Betty
Purchase Details
Closed on
Sep 23, 2000
Sold by
Emmons David E
Bought by
Emmons David E and Wilkins Betty
Home Financials for this Owner
Home Financials are based on the most recent Mortgage that was taken out on this home.
Original Mortgage
$56,000
Interest Rate
7.99%
Mortgage Type
Purchase Money Mortgage
Create a Home Valuation Report for This Property
The Home Valuation Report is an in-depth analysis detailing your home's value as well as a comparison with similar homes in the area
Home Values in the Area
Average Home Value in this Area
Purchase History
| Date | Buyer | Sale Price | Title Company |
|---|---|---|---|
| Campbell Legacy Properties Llc | -- | None Listed On Document | |
| Campbell Reed | $11,640 | Premium Title Agency | |
| U S Bank Na | $190,000 | None Available | |
| Wilkens Betty | -- | Attorney | |
| Emmons David E | -- | -- |
Source: Public Records
Mortgage History
| Date | Status | Borrower | Loan Amount |
|---|---|---|---|
| Previous Owner | Emmons David E | $56,000 |
Source: Public Records
Tax History Compared to Growth
Tax History
| Year | Tax Paid | Tax Assessment Tax Assessment Total Assessment is a certain percentage of the fair market value that is determined by local assessors to be the total taxable value of land and additions on the property. | Land | Improvement |
|---|---|---|---|---|
| 2024 | $901 | $17,900 | $4,750 | $13,150 |
| 2023 | $901 | $17,900 | $4,750 | $13,150 |
| 2022 | $961 | $14,320 | $3,800 | $10,520 |
| 2021 | $979 | $14,320 | $3,800 | $10,520 |
| 2020 | $1,382 | $14,320 | $3,800 | $10,520 |
| 2019 | $1,107 | $14,530 | $3,420 | $11,110 |
| 2018 | $1,081 | $14,530 | $3,420 | $11,110 |
| 2017 | $1,081 | $14,530 | $3,420 | $11,110 |
| 2016 | $1,076 | $14,020 | $3,800 | $10,220 |
| 2015 | $575 | $14,020 | $3,800 | $10,220 |
| 2014 | $575 | $14,020 | $3,800 | $10,220 |
| 2012 | -- | $20,670 | $3,780 | $16,890 |
Source: Public Records
Map
Nearby Homes
- 2249 Prince Albert Blvd
- 2249 Valley Pike
- 2245 Valley Pike
- - Rondowa Ave
- -- Rondowa Ave
- - Prince Albert Blvd
- -- Prince Albert Blvd
- 29 Barcelona Ave
- -- Valley Pike
- - Valley Pike
- 2249 - Valley Pike
- 2301 Valley Pike
- 2460 Bushnell Ave
- 546 Wynora Ave
- 518 Tyron Ave
- 641 Prince Albert Blvd
- 241 Community Dr
- 1930 Brandt Pike
- 3586 Lane Garden Ct
- 1020 Saint Adelbert Ave
- 15 Prince Albert Blvd
- 13 Prince Albert Blvd
- 101 Prince Albert Blvd
- 2322 Rondowa Ave
- 109 Prince Albert Blvd
- 2331 Rondowa Ave
- 2328 Rondowa Ave
- 2307 Valley Pike
- 2307 Valley St Unit 1
- 2332 Rondowa Ave
- 2335 Rondowa Ave
- 102 Prince Albert Blvd
- 2317 Valley Pike
- 2337 Rondowa Ave
- 2231 Rondowa Ave
- 2334 Rondowa Ave
- 2329 Valley Pike
- 2249 Prince Albert Ave
- 2314 Bushnell Ave
- 108 Prince Albert Blvd