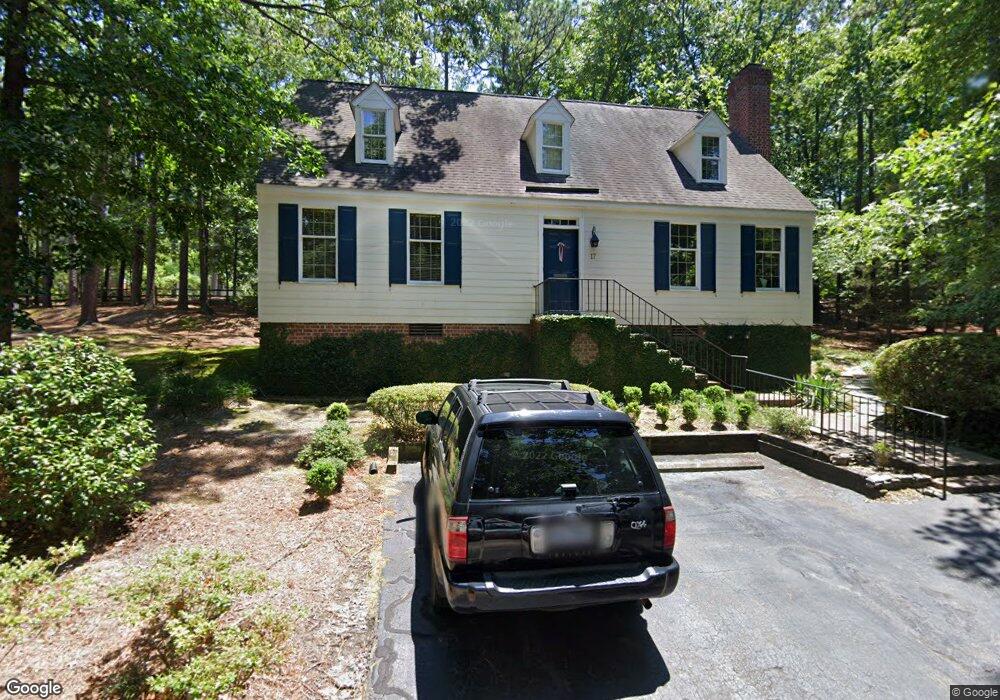
17 Village In the Woods Southern Pines, NC 28387
Estimated Value: $303,000 - $454,000
1
Bed
3
Baths
1,828
Sq Ft
$207/Sq Ft
Est. Value
About This Home
This home is located at 17 Village In the Woods, Southern Pines, NC 28387 and is currently estimated at $377,629, approximately $206 per square foot. 17 Village In the Woods is a home located in Moore County with nearby schools including Southern Pines Elementary, Southern Middle School, and Pinecrest High School.
Ownership History
Date
Name
Owned For
Owner Type
Purchase Details
Closed on
Dec 6, 2013
Sold by
Moats Benjamin F and Moats Millicent
Bought by
Fisher William Gene Linn and Fisher Jenijoy
Current Estimated Value
Home Financials for this Owner
Home Financials are based on the most recent Mortgage that was taken out on this home.
Original Mortgage
$189,540
Outstanding Balance
$142,613
Interest Rate
4.38%
Mortgage Type
VA
Estimated Equity
$235,016
Purchase Details
Closed on
Apr 11, 2007
Sold by
Moats Benjamin F and Moats Millicent
Bought by
The Benjamin F Moats & Millicent Moats R
Purchase Details
Closed on
May 25, 2006
Sold by
Moore Robert S and Moore Linda D
Bought by
Moats Ben F and Moats Millicent M
Home Financials for this Owner
Home Financials are based on the most recent Mortgage that was taken out on this home.
Original Mortgage
$132,000
Interest Rate
6.5%
Mortgage Type
New Conventional
Create a Home Valuation Report for This Property
The Home Valuation Report is an in-depth analysis detailing your home's value as well as a comparison with similar homes in the area
Home Values in the Area
Average Home Value in this Area
Purchase History
| Date | Buyer | Sale Price | Title Company |
|---|---|---|---|
| Fisher William Gene Linn | $208,000 | None Available | |
| The Benjamin F Moats & Millicent Moats R | -- | None Available | |
| Moats Ben F | $165,000 | None Available |
Source: Public Records
Mortgage History
| Date | Status | Borrower | Loan Amount |
|---|---|---|---|
| Open | Fisher William Gene Linn | $189,540 | |
| Previous Owner | Moats Ben F | $132,000 |
Source: Public Records
Tax History Compared to Growth
Tax History
| Year | Tax Paid | Tax Assessment Tax Assessment Total Assessment is a certain percentage of the fair market value that is determined by local assessors to be the total taxable value of land and additions on the property. | Land | Improvement |
|---|---|---|---|---|
| 2024 | $1,948 | $305,610 | $40,000 | $265,610 |
| 2023 | $2,009 | $305,610 | $40,000 | $265,610 |
| 2022 | $1,631 | $176,320 | $30,000 | $146,320 |
| 2021 | $1,675 | $176,320 | $30,000 | $146,320 |
| 2020 | $1,689 | $176,320 | $30,000 | $146,320 |
| 2019 | $1,689 | $176,320 | $30,000 | $146,320 |
| 2018 | $1,455 | $160,770 | $30,000 | $130,770 |
| 2017 | $1,439 | $160,770 | $30,000 | $130,770 |
| 2015 | $1,391 | $160,770 | $30,000 | $130,770 |
| 2014 | $1,355 | $158,470 | $25,000 | $133,470 |
| 2013 | -- | $158,470 | $25,000 | $133,470 |
Source: Public Records
Map
Nearby Homes
- 21 Village In the Woods
- 15 Village In the Woods
- 825 N Saylor St
- 8 Village In the Woods
- 52 Skye Dr
- 440 W New Jersey Ave
- 33 Village Green Cir
- 44 Village Green Cir
- 1 Inverness Rd
- 625 W Maine Ave
- 131 Crestview Rd
- 580 W Maine Ave
- 460 Crestview Rd
- 735 N Bennett St Unit A
- 415 W Vermont Ave
- 555 NE Broad St
- 326 N Bennett St
- 245 W Connecticut Ave
- 250 E Delaware Ave
- 280 W Connecticut Ave
- 17 Village In Woods
- 22 Village In the Woods
- 22 Village In the Woods
- 18 Village In the Woods
- 19 Village In the Woods
- 23 Village In the Woods
- 16 Village In the Woods
- 20 Village In the Woods
- 16 Village In the Woods
- 13 Village In Woods
- 13 Village In the Woods
- 26 Village In the Woods
- 805 N Saylor St
- 24 Village In the Woods
- 24 Village In the Woods
- 460 W Delaware Ave
- 795 N Saylor St
- 25 Village In Woods
- 25 Village In the Woods
- 845 N Saylor St