Estimated Value: $280,000 - $313,000
3
Beds
2
Baths
1,428
Sq Ft
$207/Sq Ft
Est. Value
About This Home
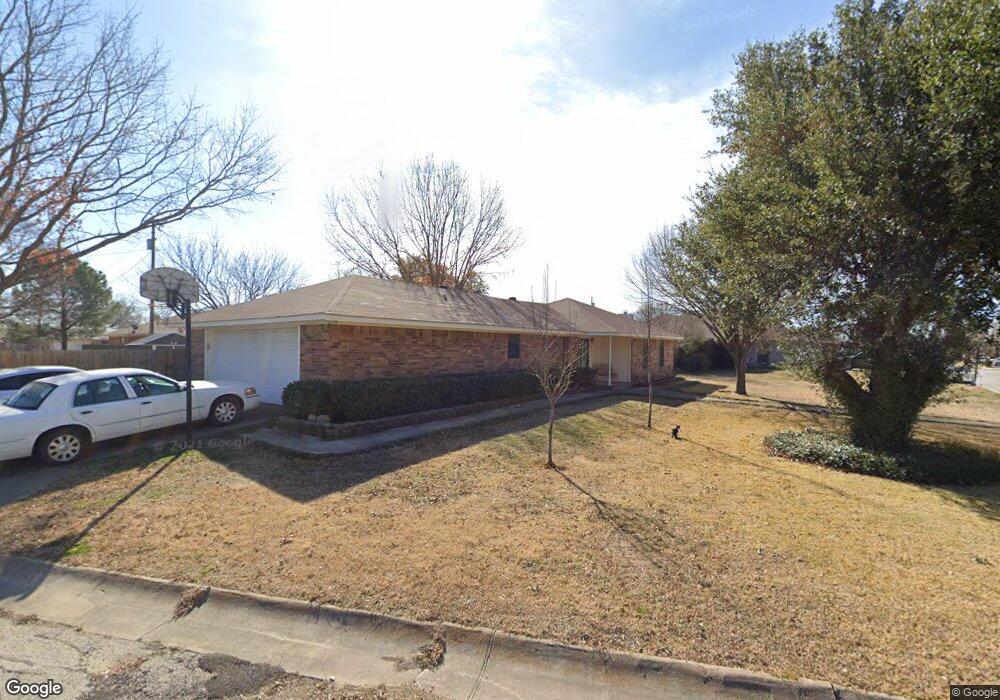
This home is located at 17 W Sharon Dr, Krum, TX 76249 and is currently estimated at $295,048, approximately $206 per square foot. 17 W Sharon Dr is a home located in Denton County with nearby schools including Krum Early Education Center, Blanche Dodd Intermediate School, and Krum Middle School.
Ownership History
Date
Name
Owned For
Owner Type
Purchase Details
Closed on
Jan 27, 1999
Sold by
Gohlke Mark C and Gohlke Keri E
Bought by
Benedict John E and Benedict Mary R
Current Estimated Value
Home Financials for this Owner
Home Financials are based on the most recent Mortgage that was taken out on this home.
Original Mortgage
$61,000
Interest Rate
6.68%
Purchase Details
Closed on
Jun 20, 1996
Sold by
Fleming Garyland H and Fleming Elizabeth D
Bought by
Gohlke Mark C and Gohlke Keri E
Home Financials for this Owner
Home Financials are based on the most recent Mortgage that was taken out on this home.
Original Mortgage
$81,748
Interest Rate
8.24%
Mortgage Type
FHA
Purchase Details
Closed on
Dec 11, 1995
Sold by
Schertz Danny and Schertz Sandra
Bought by
Fleming Gayland H and Fleming Elizabeth D
Home Financials for this Owner
Home Financials are based on the most recent Mortgage that was taken out on this home.
Original Mortgage
$18,000
Interest Rate
7.41%
Create a Home Valuation Report for This Property
The Home Valuation Report is an in-depth analysis detailing your home's value as well as a comparison with similar homes in the area
Home Values in the Area
Average Home Value in this Area
Purchase History
| Date | Buyer | Sale Price | Title Company |
|---|---|---|---|
| Benedict John E | -- | -- | |
| Gohlke Mark C | -- | -- | |
| Fleming Gayland H | -- | -- |
Source: Public Records
Mortgage History
| Date | Status | Borrower | Loan Amount |
|---|---|---|---|
| Closed | Benedict John E | $61,000 | |
| Previous Owner | Gohlke Mark C | $81,748 | |
| Previous Owner | Fleming Gayland H | $18,000 |
Source: Public Records
Tax History Compared to Growth
Tax History
| Year | Tax Paid | Tax Assessment Tax Assessment Total Assessment is a certain percentage of the fair market value that is determined by local assessors to be the total taxable value of land and additions on the property. | Land | Improvement |
|---|---|---|---|---|
| 2025 | $1,527 | $248,897 | $81,254 | $194,389 |
| 2024 | $4,560 | $226,270 | $0 | $0 |
| 2023 | $1,407 | $205,700 | $81,254 | $207,997 |
| 2022 | $4,289 | $187,000 | $66,019 | $183,981 |
| 2021 | $3,785 | $170,674 | $36,564 | $134,110 |
| 2020 | $3,667 | $161,920 | $40,627 | $128,973 |
| 2019 | $3,552 | $147,200 | $40,627 | $132,281 |
| 2018 | $3,245 | $133,818 | $40,627 | $106,263 |
| 2017 | $2,963 | $121,653 | $26,059 | $107,679 |
| 2016 | $2,694 | $110,594 | $26,059 | $86,827 |
| 2015 | $2,232 | $100,540 | $26,059 | $74,481 |
| 2013 | -- | $101,988 | $26,059 | $75,929 |
Source: Public Records
Map
Nearby Homes