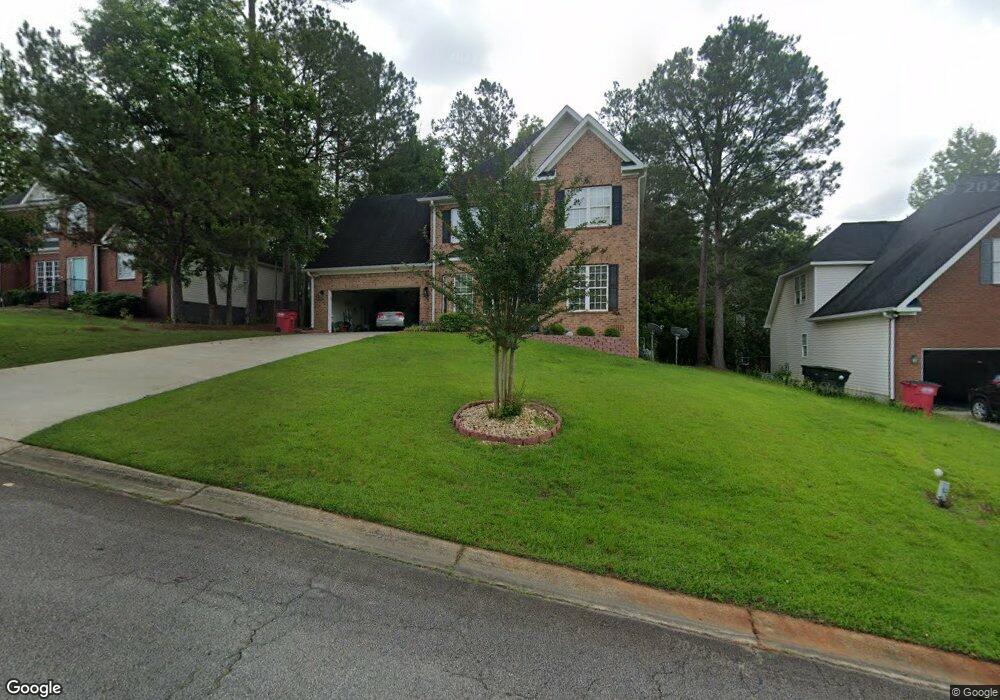
170 Brookefield Dr Macon, GA 31210
Estimated Value: $314,211 - $343,000
4
Beds
3
Baths
2,514
Sq Ft
$130/Sq Ft
Est. Value
About This Home
This home is located at 170 Brookefield Dr, Macon, GA 31210 and is currently estimated at $326,803, approximately $129 per square foot. 170 Brookefield Dr is a home located in Bibb County with nearby schools including Springdale Elementary School, Howard Middle School, and Howard High School.
Ownership History
Date
Name
Owned For
Owner Type
Purchase Details
Closed on
Sep 10, 2012
Sold by
Bacchus Andrew J and Bacchus Michelle A
Bought by
Patel Samir and Patel Hiral
Current Estimated Value
Home Financials for this Owner
Home Financials are based on the most recent Mortgage that was taken out on this home.
Original Mortgage
$160,000
Outstanding Balance
$109,711
Interest Rate
3.53%
Mortgage Type
New Conventional
Estimated Equity
$217,092
Purchase Details
Closed on
Oct 15, 2009
Sold by
Castillo Armando R
Bought by
Bacchus Andrew J and Bacchus Michelle A
Home Financials for this Owner
Home Financials are based on the most recent Mortgage that was taken out on this home.
Original Mortgage
$167,200
Interest Rate
5.05%
Mortgage Type
New Conventional
Purchase Details
Closed on
Nov 4, 2002
Bought by
Castillo Armando R
Purchase Details
Closed on
Aug 7, 2002
Create a Home Valuation Report for This Property
The Home Valuation Report is an in-depth analysis detailing your home's value as well as a comparison with similar homes in the area
Home Values in the Area
Average Home Value in this Area
Purchase History
| Date | Buyer | Sale Price | Title Company |
|---|---|---|---|
| Patel Samir | $200,000 | None Available | |
| Bacchus Andrew J | $209,000 | None Available | |
| Castillo Armando R | $191,300 | -- | |
| -- | $25,000 | -- |
Source: Public Records
Mortgage History
| Date | Status | Borrower | Loan Amount |
|---|---|---|---|
| Open | Patel Samir | $160,000 | |
| Previous Owner | Bacchus Andrew J | $167,200 |
Source: Public Records
Tax History Compared to Growth
Tax History
| Year | Tax Paid | Tax Assessment Tax Assessment Total Assessment is a certain percentage of the fair market value that is determined by local assessors to be the total taxable value of land and additions on the property. | Land | Improvement |
|---|---|---|---|---|
| 2025 | $2,855 | $116,168 | $12,000 | $104,168 |
| 2024 | $2,750 | $108,290 | $12,000 | $96,290 |
| 2023 | $3,208 | $108,290 | $12,000 | $96,290 |
| 2022 | $3,490 | $100,805 | $10,800 | $90,005 |
| 2021 | $3,230 | $85,004 | $10,000 | $75,004 |
| 2020 | $3,009 | $77,504 | $10,000 | $67,504 |
| 2019 | $3,034 | $77,504 | $10,000 | $67,504 |
| 2018 | $4,826 | $77,504 | $10,000 | $67,504 |
| 2017 | $2,763 | $73,754 | $10,000 | $63,754 |
| 2016 | $2,422 | $70,004 | $10,000 | $60,004 |
| 2015 | $3,428 | $70,004 | $10,000 | $60,004 |
| 2014 | $3,617 | $73,754 | $10,000 | $63,754 |
Source: Public Records
Map
Nearby Homes
- 168 Brookefield Dr
- 172 Brookefield Dr
- 633 Millrun Ct
- 523 Edgefield Way
- 164 Brookefield Dr
- 525 Edgefield Way
- 171 Brookefield Dr
- 167 Brookefield Dr
- 631 Millrun Ct
- 527 Edgefield Way
- 163 Brookefield Dr
- 634 Millrun Ct
- 629 Millrun Ct
- 641 Millrun Ct
- 160 Brookefield Dr
- 636 Millrun Ct
- 529 Edgefield Way
- 529 Edgefield Way Unit 349
- 524 Edgefield Way
- 509 Edgefield Way