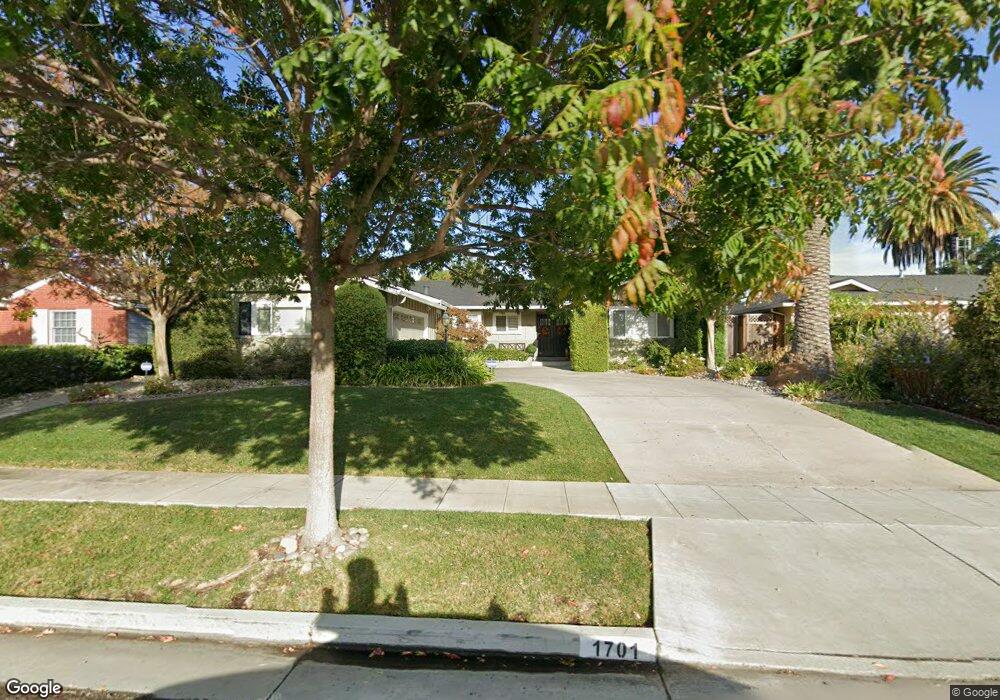
1701 Husted Ave San Jose, CA 95124
Doerr-Steindorf NeighborhoodEstimated Value: $2,501,000 - $2,762,000
4
Beds
3
Baths
2,581
Sq Ft
$1,001/Sq Ft
Est. Value
About This Home
This home is located at 1701 Husted Ave, San Jose, CA 95124 and is currently estimated at $2,583,818, approximately $1,001 per square foot. 1701 Husted Ave is a home located in Santa Clara County with nearby schools including Schallenberger Elementary School, Willow Glen Middle, and Willow Glen High School.
Ownership History
Date
Name
Owned For
Owner Type
Purchase Details
Closed on
Jun 11, 2020
Sold by
Anderson David R and Anderson Sandra R
Bought by
Anderson David R and Anderson Sandra R
Current Estimated Value
Purchase Details
Closed on
Jan 21, 2010
Sold by
Shirk Valerie and Shirk Grant
Bought by
Anderson David R and Anderson Sandra R
Home Financials for this Owner
Home Financials are based on the most recent Mortgage that was taken out on this home.
Original Mortgage
$525,000
Outstanding Balance
$343,993
Interest Rate
4.91%
Mortgage Type
New Conventional
Estimated Equity
$2,239,825
Purchase Details
Closed on
Oct 25, 2004
Sold by
Clare Johnson Janice and Johnson Gregory Neil
Bought by
Shirk Grant and Shirk Valerie
Home Financials for this Owner
Home Financials are based on the most recent Mortgage that was taken out on this home.
Original Mortgage
$680,000
Interest Rate
5.69%
Mortgage Type
Purchase Money Mortgage
Purchase Details
Closed on
Feb 13, 2003
Sold by
Clare Johnson Janice and Lewin Janice
Bought by
Johnson Gregory Neil and Clare Johnson Janice
Home Financials for this Owner
Home Financials are based on the most recent Mortgage that was taken out on this home.
Original Mortgage
$360,000
Interest Rate
5.25%
Purchase Details
Closed on
Nov 26, 2001
Sold by
Lewin Janice
Bought by
Lewis Janice
Home Financials for this Owner
Home Financials are based on the most recent Mortgage that was taken out on this home.
Original Mortgage
$255,000
Interest Rate
6.67%
Purchase Details
Closed on
Apr 20, 2000
Sold by
Hulberg Norman C Trustee
Bought by
Lewin Janice
Home Financials for this Owner
Home Financials are based on the most recent Mortgage that was taken out on this home.
Original Mortgage
$581,000
Interest Rate
8.24%
Purchase Details
Closed on
Apr 2, 1999
Sold by
Hulberg Norman C
Bought by
Hulberg Norman C
Home Financials for this Owner
Home Financials are based on the most recent Mortgage that was taken out on this home.
Original Mortgage
$330,000
Interest Rate
2.9%
Purchase Details
Closed on
Feb 17, 1999
Sold by
Hulberg Lisa M
Bought by
Hulberg Norman C
Home Financials for this Owner
Home Financials are based on the most recent Mortgage that was taken out on this home.
Original Mortgage
$330,000
Interest Rate
2.9%
Purchase Details
Closed on
Mar 28, 1997
Sold by
Hulberg Norman C
Bought by
Hulberg Norman C
Purchase Details
Closed on
Feb 4, 1993
Sold by
Hulberg Mary Jane
Bought by
Hulberg Norman C
Create a Home Valuation Report for This Property
The Home Valuation Report is an in-depth analysis detailing your home's value as well as a comparison with similar homes in the area
Home Values in the Area
Average Home Value in this Area
Purchase History
| Date | Buyer | Sale Price | Title Company |
|---|---|---|---|
| Anderson David R | -- | None Available | |
| Anderson David R | $965,000 | Old Republic Title Company | |
| Shirk Grant | $899,000 | Old Republic Title Company | |
| Johnson Gregory Neil | -- | Alliance Title Company | |
| Lewis Janice | -- | Alliance Title Company | |
| Lewin Janice | $830,000 | Stewart Title | |
| Hulberg Norman C | -- | -- | |
| Hulberg Norman C | -- | Financial Title Company | |
| Hulberg Norman C | -- | Financial Title Company | |
| Hulberg Norman C | -- | -- | |
| Hulberg Norman C | -- | -- |
Source: Public Records
Mortgage History
| Date | Status | Borrower | Loan Amount |
|---|---|---|---|
| Open | Anderson David R | $525,000 | |
| Previous Owner | Shirk Grant | $680,000 | |
| Previous Owner | Johnson Gregory Neil | $360,000 | |
| Previous Owner | Lewis Janice | $255,000 | |
| Previous Owner | Lewin Janice | $581,000 | |
| Previous Owner | Hulberg Norman C | $330,000 | |
| Closed | Johnson Gregory Neil | $80,000 |
Source: Public Records
Tax History Compared to Growth
Tax History
| Year | Tax Paid | Tax Assessment Tax Assessment Total Assessment is a certain percentage of the fair market value that is determined by local assessors to be the total taxable value of land and additions on the property. | Land | Improvement |
|---|---|---|---|---|
| 2025 | $15,605 | $1,245,626 | $871,942 | $373,684 |
| 2024 | $15,605 | $1,221,203 | $854,846 | $366,357 |
| 2023 | $15,319 | $1,197,259 | $838,085 | $359,174 |
| 2022 | $15,174 | $1,173,784 | $821,652 | $352,132 |
| 2021 | $14,877 | $1,150,770 | $805,542 | $345,228 |
| 2020 | $14,556 | $1,138,972 | $797,283 | $341,689 |
| 2019 | $14,251 | $1,116,640 | $781,650 | $334,990 |
| 2018 | $14,114 | $1,094,746 | $766,324 | $328,422 |
| 2017 | $14,005 | $1,073,282 | $751,299 | $321,983 |
| 2016 | $13,797 | $1,052,238 | $736,568 | $315,670 |
| 2015 | $13,712 | $1,036,434 | $725,505 | $310,929 |
| 2014 | $13,178 | $1,016,133 | $711,294 | $304,839 |
Source: Public Records
Map
Nearby Homes
- 1705 Harte Dr
- 1741 Harte Dr
- 2881 Meridian Ave Unit 264
- 2881 Meridian Ave Unit 217
- 2881 Meridian Ave Unit 224
- 2514 Meridian Ave
- 2498 Raleigh Dr
- 1701 Foxworthy Ave
- 2536 Malaga Dr
- 1736 Frobisher Way
- 1791 Frobisher Way
- 2772 Quinto Way
- 1632 Trona Way
- 1665 Fairorchard Ave
- 1629 Glenfield Dr
- 3155 Franela Dr
- 2917 Quinto Way
- 2425 Briarwood Dr
- 1831 Frobisher Way
- 2322 Meridian Ave
- 1699 Husted Ave
- 1703 Husted Ave
- 1712 Fabian Dr
- 1697 Husted Ave
- 1714 Fabian Dr
- 1710 Fabian Dr
- 1716 Fabian Dr
- 1705 Husted Ave
- 1698 Husted Ave
- 1700 Husted Ave
- 1708 Fabian Dr
- 1695 Husted Ave
- 1696 Husted Ave
- 1718 Fabian Dr
- 1702 Husted Ave
- 1694 Husted Ave
- 1704 Husted Ave
- 1707 Husted Ave
- 1722 Fabian Dr
- 1693 Husted Ave