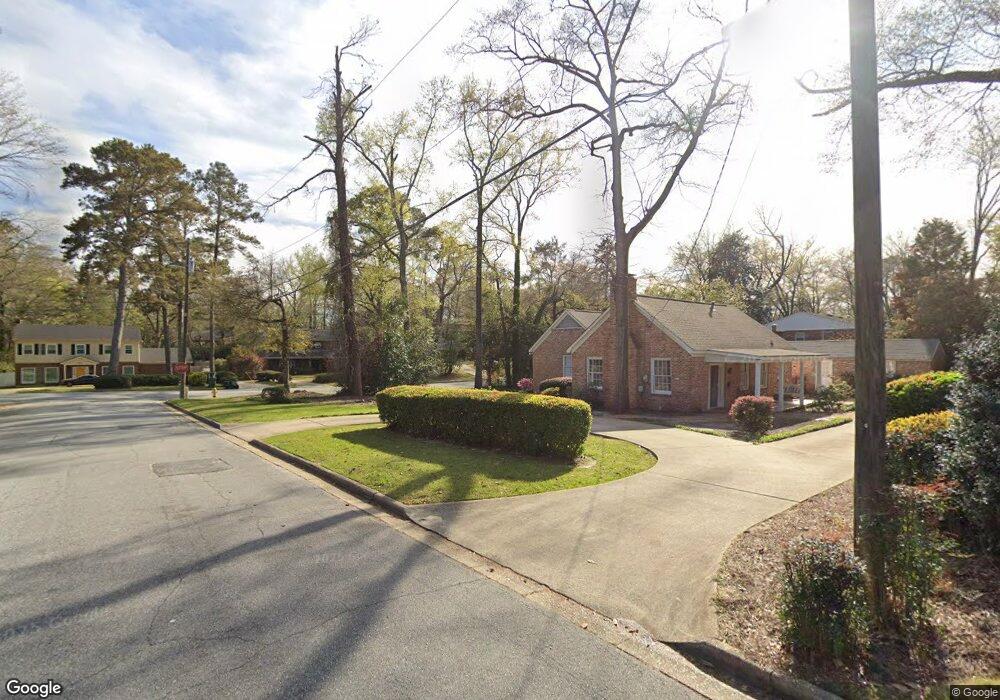
1705 N Dixon Dr Columbus, GA 31906
Wynnton Grove NeighborhoodEstimated Value: $251,000 - $306,000
3
Beds
3
Baths
1,784
Sq Ft
$155/Sq Ft
Est. Value
About This Home
This home is located at 1705 N Dixon Dr, Columbus, GA 31906 and is currently estimated at $276,432, approximately $154 per square foot. 1705 N Dixon Dr is a home located in Muscogee County with nearby schools including Wilkinson Elementary School, Richards Middle School, and Hardaway High School.
Ownership History
Date
Name
Owned For
Owner Type
Purchase Details
Closed on
Jan 2, 2019
Sold by
Trkovsky Courtney
Bought by
Goebel Zachary M and Goebel Tara Lynne
Current Estimated Value
Home Financials for this Owner
Home Financials are based on the most recent Mortgage that was taken out on this home.
Original Mortgage
$149,785
Outstanding Balance
$131,958
Interest Rate
4.7%
Estimated Equity
$144,474
Purchase Details
Closed on
Sep 27, 2018
Sold by
Harrell Gayle M
Bought by
Harrell Gayle M and Trkovsky Courtney
Purchase Details
Closed on
Feb 29, 2008
Sold by
Gemmette Gayle M
Bought by
Harrell Gayle M
Home Financials for this Owner
Home Financials are based on the most recent Mortgage that was taken out on this home.
Original Mortgage
$106,500
Interest Rate
5.46%
Mortgage Type
Purchase Money Mortgage
Create a Home Valuation Report for This Property
The Home Valuation Report is an in-depth analysis detailing your home's value as well as a comparison with similar homes in the area
Home Values in the Area
Average Home Value in this Area
Purchase History
| Date | Buyer | Sale Price | Title Company |
|---|---|---|---|
| Goebel Zachary M | $145,000 | -- | |
| Harrell Gayle M | -- | -- | |
| Harrell Gayle M | -- | None Available |
Source: Public Records
Mortgage History
| Date | Status | Borrower | Loan Amount |
|---|---|---|---|
| Open | Goebel Zachary M | $149,785 | |
| Previous Owner | Harrell Gayle M | $106,500 |
Source: Public Records
Tax History Compared to Growth
Tax History
| Year | Tax Paid | Tax Assessment Tax Assessment Total Assessment is a certain percentage of the fair market value that is determined by local assessors to be the total taxable value of land and additions on the property. | Land | Improvement |
|---|---|---|---|---|
| 2025 | $344 | $87,932 | $17,924 | $70,008 |
| 2024 | $3,442 | $87,932 | $17,924 | $70,008 |
| 2023 | $3,464 | $87,932 | $17,924 | $70,008 |
| 2022 | $2,991 | $73,244 | $17,924 | $55,320 |
| 2021 | $2,356 | $57,704 | $17,924 | $39,780 |
| 2020 | $2,357 | $57,704 | $17,924 | $39,780 |
| 2019 | $2,364 | $57,704 | $17,924 | $39,780 |
| 2018 | $2,364 | $57,704 | $17,924 | $39,780 |
| 2017 | $2,520 | $61,312 | $17,924 | $43,388 |
| 2016 | $2,447 | $59,317 | $5,404 | $53,913 |
| 2015 | $2,450 | $59,317 | $5,404 | $53,913 |
| 2014 | $2,453 | $59,317 | $5,404 | $53,913 |
| 2013 | -- | $59,317 | $5,404 | $53,913 |
Source: Public Records
Map
Nearby Homes
- 1700 Stark Ave
- 1706 Stark Ave
- 1717 Stark Ave
- 2010 Wells Dr
- 1513 Wells Dr
- 1809 Carter Ave
- 2533 15th St
- 1500 Preston Dr
- 1319 Hilton Ave
- 2911 Gardenia St
- 1712 Marilon Dr
- 2916 Gardenia St
- 1310 S Dixon Dr
- 1164 Tate Dr
- 2125 13th St Unit 12
- 2133 13th St
- 2817 Carson Dr
- 1301 Rigdon Rd
- 2016 Poplar Dr
- 2609 Hilton Ave