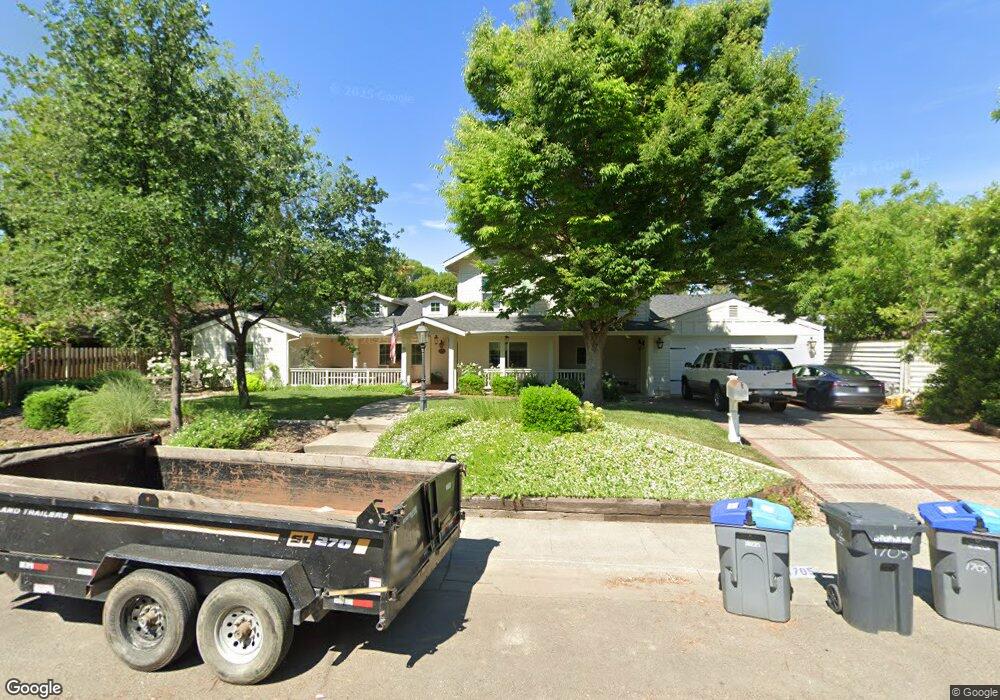
1705 Redwood Ln Davis, CA 95616
Central Davis NeighborhoodEstimated Value: $783,000 - $1,709,713
4
Beds
3
Baths
2,937
Sq Ft
$448/Sq Ft
Est. Value
About This Home
This home is located at 1705 Redwood Ln, Davis, CA 95616 and is currently estimated at $1,316,678, approximately $448 per square foot. 1705 Redwood Ln is a home located in Yolo County with nearby schools including Robert E. Willett Elementary School, Ralph Waldo Emerson Junior High School, and Davis Senior High School.
Ownership History
Date
Name
Owned For
Owner Type
Purchase Details
Closed on
Oct 27, 2022
Sold by
Heringer Stephen and Heringer Sarah
Bought by
Ssgefhj 2022 Family Trust
Current Estimated Value
Purchase Details
Closed on
Jan 2, 2020
Sold by
Heringer Stephen and Heringer Sarah
Bought by
Heringer Stephen and Heringer Sarah
Home Financials for this Owner
Home Financials are based on the most recent Mortgage that was taken out on this home.
Original Mortgage
$770,000
Interest Rate
3.6%
Mortgage Type
New Conventional
Purchase Details
Closed on
Sep 13, 2011
Sold by
Macsween Cynthia
Bought by
Heringer Stephen F and Heringer Sarah
Home Financials for this Owner
Home Financials are based on the most recent Mortgage that was taken out on this home.
Original Mortgage
$592,312
Interest Rate
4.37%
Mortgage Type
VA
Purchase Details
Closed on
Sep 24, 1996
Sold by
Damesyn Hubert A and Damesyn Janet K
Bought by
Damesyn Hubert A and Damesyn Jan K
Create a Home Valuation Report for This Property
The Home Valuation Report is an in-depth analysis detailing your home's value as well as a comparison with similar homes in the area
Home Values in the Area
Average Home Value in this Area
Purchase History
| Date | Buyer | Sale Price | Title Company |
|---|---|---|---|
| Ssgefhj 2022 Family Trust | -- | -- | |
| Heringer Stephen | -- | Fidelity Natl Ttl Co Of Ca | |
| Heringer Stephen F | $650,000 | Placer Title Company | |
| Damesyn Hubert A | -- | -- |
Source: Public Records
Mortgage History
| Date | Status | Borrower | Loan Amount |
|---|---|---|---|
| Previous Owner | Heringer Stephen | $770,000 | |
| Previous Owner | Heringer Stephen F | $592,312 |
Source: Public Records
Tax History Compared to Growth
Tax History
| Year | Tax Paid | Tax Assessment Tax Assessment Total Assessment is a certain percentage of the fair market value that is determined by local assessors to be the total taxable value of land and additions on the property. | Land | Improvement |
|---|---|---|---|---|
| 2025 | $11,323 | $927,355 | $452,175 | $475,180 |
| 2023 | $11,323 | $891,346 | $434,617 | $456,729 |
| 2022 | $10,867 | $873,870 | $426,096 | $447,774 |
| 2021 | $10,628 | $856,737 | $417,742 | $438,995 |
| 2020 | $10,467 | $847,953 | $413,459 | $434,494 |
| 2019 | $10,090 | $831,327 | $405,352 | $425,975 |
| 2018 | $9,373 | $815,027 | $397,404 | $417,623 |
| 2017 | $9,184 | $799,047 | $389,612 | $409,435 |
| 2016 | $8,867 | $775,697 | $381,973 | $393,724 |
| 2015 | $7,698 | $679,314 | $376,236 | $303,078 |
| 2014 | $7,698 | $666,009 | $368,867 | $297,142 |
Source: Public Records
Map
Nearby Homes
- 436 Citadel Dr
- 2007 Alta Loma St
- 2008 Alta Loma St
- 431 Balboa Ave
- 234 Baja Ave
- 247 El Cajon Ave
- 2128 Bueno Dr Unit 19
- 820 Eureka Ave
- 2818 Anza Ave
- 1313-15 F St
- 916 B St
- 1560 Drake Dr
- 1661 Spring St Unit 424
- 1661 Spring St Unit 341
- 1661 Spring St Unit 343
- 1325 Brown Dr
- 2248 Cannery Loop
- 957 Jacobsen Ln
- 632 Hermosa Place
- 754 Hawthorn Ln
- 1711 Redwood Ln
- 1627 Redwood Ln
- 1717 Redwood Ln
- 1621 Redwood Ln
- 1628 Redwood Ln
- 1712 Redwood Ln
- 1622 Redwood Ln
- 1615 Redwood Ln
- 1807 Redwood Ln
- 1616 Redwood Ln
- 1718 Redwood Ln
- 1609 Redwood Ln
- 1610 Redwood Ln
- 1808 Redwood Ln
- 1813 Redwood Ln
- 429 Scripps Dr
- 423 Scripps Dr
- 1604 Redwood Ln
- 435 Scripps Dr
- 503 Scripps Dr