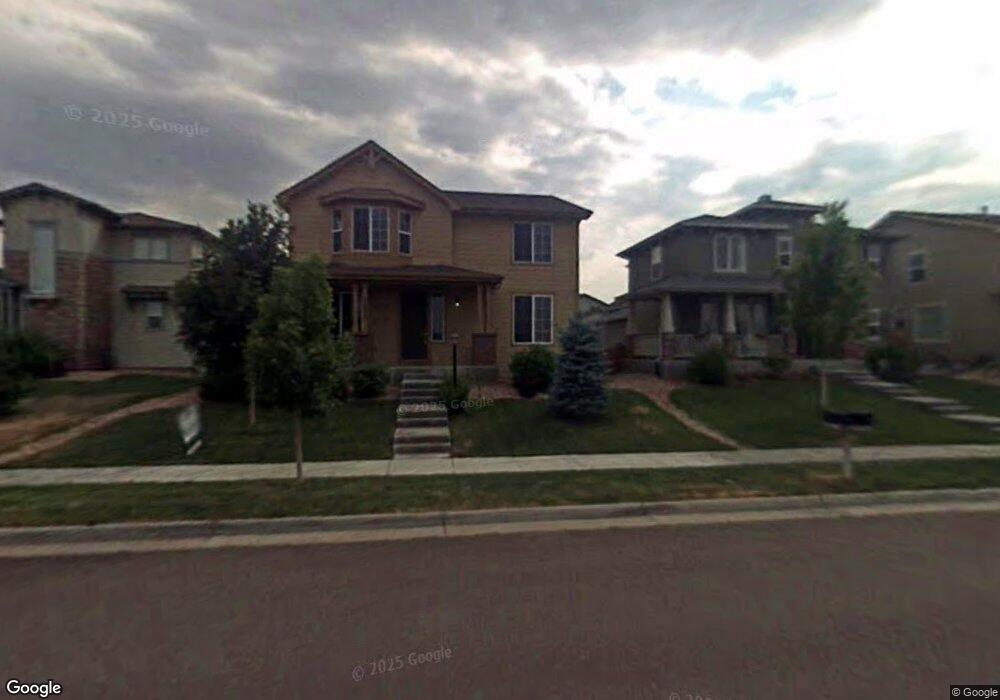
17072 Parkside Dr S Commerce City, CO 80022
Reunion NeighborhoodEstimated Value: $561,000 - $642,000
4
Beds
3
Baths
3,682
Sq Ft
$161/Sq Ft
Est. Value
About This Home
This home is located at 17072 Parkside Dr S, Commerce City, CO 80022 and is currently estimated at $592,448, approximately $160 per square foot. 17072 Parkside Dr S is a home located in Adams County with nearby schools including Reunion Elementary School, Otho E Stuart Middle School, and Prairie View High School.
Ownership History
Date
Name
Owned For
Owner Type
Purchase Details
Closed on
Apr 15, 2016
Bought by
Salas Joseph J
Current Estimated Value
Home Financials for this Owner
Home Financials are based on the most recent Mortgage that was taken out on this home.
Original Mortgage
$137,700
Outstanding Balance
$109,034
Interest Rate
3.58%
Estimated Equity
$483,414
Purchase Details
Closed on
Sep 26, 2008
Sold by
Seay Linda J
Bought by
Salas Joseph J and Salas Abbi L
Home Financials for this Owner
Home Financials are based on the most recent Mortgage that was taken out on this home.
Original Mortgage
$164,529
Interest Rate
6.52%
Mortgage Type
Purchase Money Mortgage
Purchase Details
Closed on
Apr 12, 2005
Sold by
Shea Homes Lp
Bought by
Seay Linda J
Home Financials for this Owner
Home Financials are based on the most recent Mortgage that was taken out on this home.
Original Mortgage
$279,450
Interest Rate
2.37%
Mortgage Type
Fannie Mae Freddie Mac
Create a Home Valuation Report for This Property
The Home Valuation Report is an in-depth analysis detailing your home's value as well as a comparison with similar homes in the area
Home Values in the Area
Average Home Value in this Area
Purchase History
| Date | Buyer | Sale Price | Title Company |
|---|---|---|---|
| Salas Joseph J | -- | -- | |
| Salas Joseph J | $205,662 | Wtg | |
| Seay Linda J | $310,519 | North American Title |
Source: Public Records
Mortgage History
| Date | Status | Borrower | Loan Amount |
|---|---|---|---|
| Open | Salas Joseph J | $137,700 | |
| Closed | Salas Joseph J | -- | |
| Previous Owner | Salas Joseph J | $164,529 | |
| Previous Owner | Seay Linda J | $279,450 |
Source: Public Records
Tax History Compared to Growth
Tax History
| Year | Tax Paid | Tax Assessment Tax Assessment Total Assessment is a certain percentage of the fair market value that is determined by local assessors to be the total taxable value of land and additions on the property. | Land | Improvement |
|---|---|---|---|---|
| 2024 | $7,985 | $35,880 | $7,500 | $28,380 |
| 2023 | $7,960 | $41,400 | $7,440 | $33,960 |
| 2022 | $7,177 | $32,390 | $7,650 | $24,740 |
| 2021 | $7,026 | $32,390 | $7,650 | $24,740 |
| 2020 | $6,730 | $32,040 | $7,870 | $24,170 |
| 2019 | $6,761 | $32,040 | $7,870 | $24,170 |
| 2018 | $6,146 | $28,130 | $7,200 | $20,930 |
| 2017 | $5,659 | $26,520 | $7,200 | $19,320 |
| 2016 | $4,757 | $23,130 | $5,170 | $17,960 |
| 2015 | $4,755 | $23,130 | $5,170 | $17,960 |
| 2014 | $4,096 | $20,060 | $4,300 | $15,760 |
Source: Public Records
Map
Nearby Homes
- 17045 E 105th Ave
- 16743 Parkside Dr S
- 16673 Parkside Dr S
- 10505 Richfield St
- 10609 Ouray Ct
- 10550 Sedalia St
- 16650 E 107th Ct
- 17741 Parkside Dr N
- 17070 E 104th Place
- 17310 E 104th Place
- 17841 Parkside Dr N
- 16724 E 105th Ave
- 10661 Reunion Pkwy
- 10680 Norfolk St
- 10440 Olathe St
- Plan 3201 at Reunion Ridge - Crescendo Collection at Reunion
- Plan 3203 at Reunion Ridge - Crescendo Collection at Reunion
- Plan 3202 at Reunion Ridge - Crescendo Collection at Reunion
- Plan 3205 at Reunion Ridge - Crescendo Collection at Reunion
- Plan 3204 at Reunion Ridge - Crescendo Collection at Reunion
- 17062 Parkside Dr S
- 17062 Parkside Dr S Unit S
- 17082 Parkside Dr S
- 17052 Parkside Dr S
- 17092 Parkside Dr S
- 17071 E 107th Ave
- 17061 E 107th Ave
- 17081 E 107th Ave
- 17042 Parkside Dr S
- 17051 E 107th Ave
- 17091 E 107th Ave
- 17041 E 107th Ave
- 17032 Parkside Dr S
- 17031 E 107th Ave
- 17022 Parkside Dr S
- 32920 E 88th Ave
- 33162 E 88th Ave
- 17021 E 107th Ave
- 17202 Parkside Dr S
- 17080 E 107th Ave