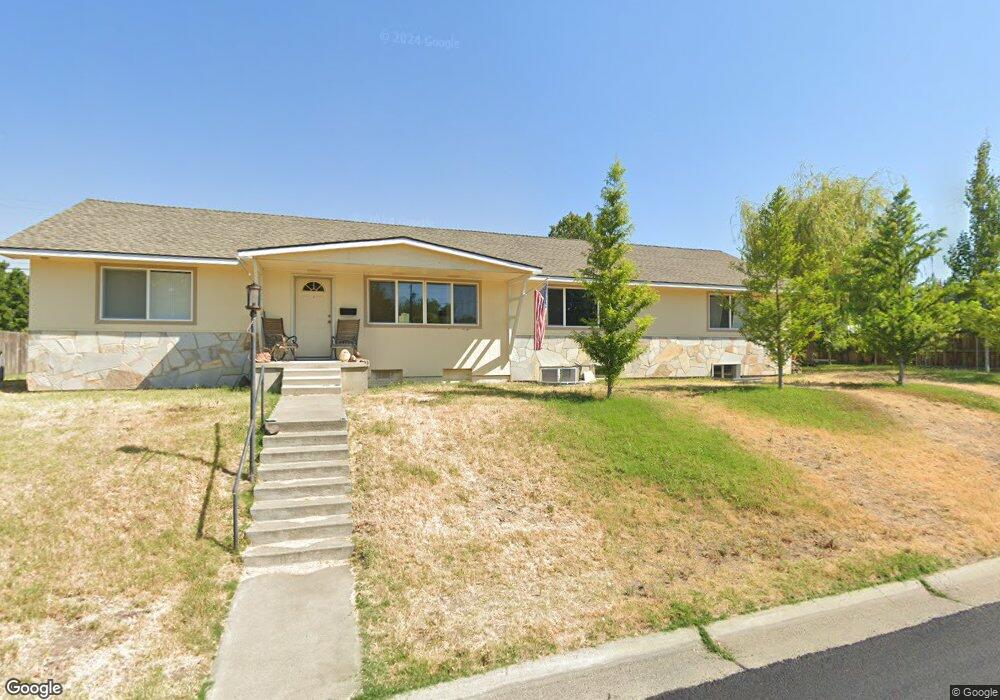
1708 Hunt Ave Richland, WA 99354
Estimated Value: $414,158 - $526,000
4
Beds
3
Baths
3,225
Sq Ft
$149/Sq Ft
Est. Value
About This Home
This home is located at 1708 Hunt Ave, Richland, WA 99354 and is currently estimated at $479,040, approximately $148 per square foot. 1708 Hunt Ave is a home located in Benton County with nearby schools including Jefferson Elementary School, Chief Joseph Middle School, and Hanford High School.
Ownership History
Date
Name
Owned For
Owner Type
Purchase Details
Closed on
Dec 16, 2009
Sold by
Speer Ralph and Speer Edith L
Bought by
Splattstoesser Leslie E and Splattstoesser Sarah A
Current Estimated Value
Home Financials for this Owner
Home Financials are based on the most recent Mortgage that was taken out on this home.
Original Mortgage
$192,449
Outstanding Balance
$125,591
Interest Rate
4.91%
Mortgage Type
FHA
Estimated Equity
$353,449
Purchase Details
Closed on
Aug 18, 2006
Sold by
Sutton Jerry and Sutton Barbara
Bought by
Speer Edith L
Home Financials for this Owner
Home Financials are based on the most recent Mortgage that was taken out on this home.
Original Mortgage
$140,250
Interest Rate
6.76%
Mortgage Type
Purchase Money Mortgage
Purchase Details
Closed on
Aug 16, 2006
Sold by
Speer Ralph H
Bought by
Speer Edith L
Home Financials for this Owner
Home Financials are based on the most recent Mortgage that was taken out on this home.
Original Mortgage
$140,250
Interest Rate
6.76%
Mortgage Type
Purchase Money Mortgage
Create a Home Valuation Report for This Property
The Home Valuation Report is an in-depth analysis detailing your home's value as well as a comparison with similar homes in the area
Home Values in the Area
Average Home Value in this Area
Purchase History
| Date | Buyer | Sale Price | Title Company |
|---|---|---|---|
| Splattstoesser Leslie E | $196,000 | Chicago Title | |
| Speer Edith L | $195,500 | Cascade Title | |
| Speer Edith L | -- | Cascade Title |
Source: Public Records
Mortgage History
| Date | Status | Borrower | Loan Amount |
|---|---|---|---|
| Open | Splattstoesser Leslie E | $192,449 | |
| Previous Owner | Speer Edith L | $140,250 |
Source: Public Records
Tax History Compared to Growth
Tax History
| Year | Tax Paid | Tax Assessment Tax Assessment Total Assessment is a certain percentage of the fair market value that is determined by local assessors to be the total taxable value of land and additions on the property. | Land | Improvement |
|---|---|---|---|---|
| 2024 | $3,115 | $363,210 | $50,000 | $313,210 |
| 2023 | $3,115 | $331,090 | $50,000 | $281,090 |
| 2022 | $3,135 | $290,930 | $50,000 | $240,930 |
| 2021 | $3,078 | $282,900 | $50,000 | $232,900 |
| 2020 | $2,676 | $266,830 | $50,000 | $216,830 |
| 2019 | $2,130 | $218,890 | $36,000 | $182,890 |
| 2018 | $2,203 | $187,360 | $36,000 | $151,360 |
| 2017 | $1,934 | $162,130 | $36,000 | $126,130 |
| 2016 | $2,172 | $162,130 | $36,000 | $126,130 |
| 2015 | $2,213 | $184,840 | $36,000 | $148,840 |
| 2014 | -- | $184,840 | $36,000 | $148,840 |
| 2013 | -- | $184,840 | $36,000 | $148,840 |
Source: Public Records
Map
Nearby Homes
- 1920 Howell Ave
- 1912 Hood Ave
- 1604 Johnston Ave
- 1918 Pike Ave
- 509 Taylor St
- 1609 Judson Ave
- 609 Torbett St
- 1511 Goethals Dr
- 515 Blue St
- 1509 Kimball Ave
- 7004 Ricky Rd
- 6614 Elvy Way Unit 11
- 7524 Kohler Rd
- 12621 Jayleen Way
- 1311 Goethals Dr Unit E
- 2045 Davison Ave
- LaCrosse Plan at Spencer Estates
- Capri Plan at Spencer Estates
- Aria Flex Plan at Spencer Estates
- Laurelhurst Plan at Spencer Estates
- 1712 Hunt Ave
- 1702 Hunt Ave
- 1714 Hunt Ave
- 1711 Hunt Ave
- 1705 Hunt Ave
- 1706 Gaillard Place
- 1710 Gaillard Place
- 1713 Hunt Ave
- 1700 Gaillard Place
- 1714 Gaillard Place
- 1622 Hunt Ave
- 1720 Hunt Ave
- 1625 Hunt Ave
- 71 Wordrop St
- 1626 Gaillard Place
- 1702 Gaillard Place
- 1630 Davison Ave
- 1718 Gaillard Place
- 1628 Davison Ave
- 1626 Davison Ave