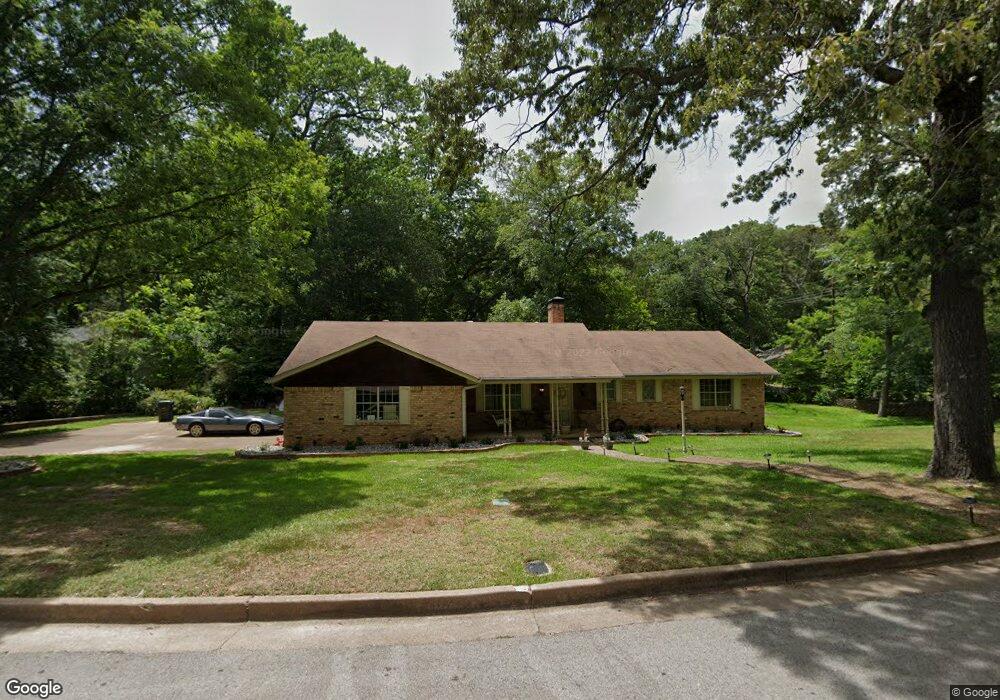
1709 Merrill Dr Tyler, TX 75701
Midtown Tyler NeighborhoodEstimated Value: $261,893 - $302,000
3
Beds
2
Baths
1,755
Sq Ft
$159/Sq Ft
Est. Value
About This Home
This home is located at 1709 Merrill Dr, Tyler, TX 75701 and is currently estimated at $278,473, approximately $158 per square foot. 1709 Merrill Dr is a home located in Smith County with nearby schools including Bell Elementary School, Hubbard Middle School, and Tyler Legacy High School.
Ownership History
Date
Name
Owned For
Owner Type
Purchase Details
Closed on
Nov 28, 2017
Sold by
Loera Domenica Campos
Bought by
Loera Luis Miguel
Current Estimated Value
Purchase Details
Closed on
Jun 9, 2016
Sold by
Grossman Monica J and Womacke Phyllis
Bought by
Loera Luis Miguel
Home Financials for this Owner
Home Financials are based on the most recent Mortgage that was taken out on this home.
Original Mortgage
$127,500
Outstanding Balance
$101,224
Interest Rate
3.66%
Mortgage Type
Purchase Money Mortgage
Estimated Equity
$177,249
Purchase Details
Closed on
Jul 13, 2009
Sold by
Womack Phyllis and Womack William H
Bought by
Grossman Monica J
Purchase Details
Closed on
Jun 22, 2009
Sold by
Childress James
Bought by
Womack Phyllis
Purchase Details
Closed on
Sep 5, 2007
Sold by
Childress Charlene E
Bought by
Childress James
Create a Home Valuation Report for This Property
The Home Valuation Report is an in-depth analysis detailing your home's value as well as a comparison with similar homes in the area
Home Values in the Area
Average Home Value in this Area
Purchase History
| Date | Buyer | Sale Price | Title Company |
|---|---|---|---|
| Loera Luis Miguel | -- | None Available | |
| Loera Luis Miguel | -- | None Available | |
| Grossman Monica J | -- | None Available | |
| Womack Phyllis | -- | None Available | |
| Childress James | -- | None Available |
Source: Public Records
Mortgage History
| Date | Status | Borrower | Loan Amount |
|---|---|---|---|
| Open | Loera Luis Miguel | $127,500 |
Source: Public Records
Tax History Compared to Growth
Tax History
| Year | Tax Paid | Tax Assessment Tax Assessment Total Assessment is a certain percentage of the fair market value that is determined by local assessors to be the total taxable value of land and additions on the property. | Land | Improvement |
|---|---|---|---|---|
| 2025 | $3,111 | $261,629 | $51,904 | $209,725 |
| 2024 | $3,111 | $240,431 | $55,935 | $233,650 |
| 2023 | $3,810 | $278,883 | $55,935 | $222,948 |
| 2022 | $4,483 | $228,833 | $55,935 | $172,898 |
| 2021 | $3,790 | $180,640 | $48,477 | $132,163 |
| 2020 | $3,669 | $171,446 | $48,477 | $122,969 |
| 2019 | $3,438 | $157,210 | $41,019 | $116,191 |
| 2018 | $3,405 | $156,542 | $37,290 | $119,252 |
| 2017 | $3,342 | $156,542 | $37,290 | $119,252 |
| 2016 | $3,230 | $151,302 | $37,290 | $114,012 |
| 2015 | -- | $143,735 | $37,290 | $106,445 |
| 2014 | -- | $140,499 | $37,290 | $103,209 |
Source: Public Records
Map
Nearby Homes
- 1715 Ridgeview Dr
- 1730 S Mahon Ave
- 2015 E 5th St
- 1725 S Mahon Ave
- 1515 E 6th St
- 1520 Clubview Dr
- 1422 Sunset Dr
- 1400 San Antonio St
- 1914 Parklen St
- 1322 Sunset Dr
- 1910 E Lake St
- 2331 Hunter St
- 1300 Sunset Dr
- 1929 Oakhurst Cir
- 2320 Sarasota Dr
- 2408 Hunter St
- 1528 E Devine St
- 912 S Palmer Ave
- 2010 McDonald Rd
- 2006 McDonald Rd
- 1709 1709 Merrill Dr
- 1723 Merrill Dr
- 1819 E Hankerson St
- 1702 1702 Merrill
- 1708 1708 Merrill Dr
- 1702 Merrill Dr
- 1708 Merrill Dr
- 1621 1621 Merrill Dr
- 1624 1624 Merrill
- 1621 Merrill Dr
- 1714 Merrill Dr
- 1624 Merrill Dr
- 1727 1727 Merrill Dr
- 1820 E Hankerson St
- 1820 E Hankerson St
- 1727 Merrill Dr
- 1618 1618 Merrill Dr
- 1720 1720 Merrill
- 1618 Merrill Dr
- 1728 Merrill Dr