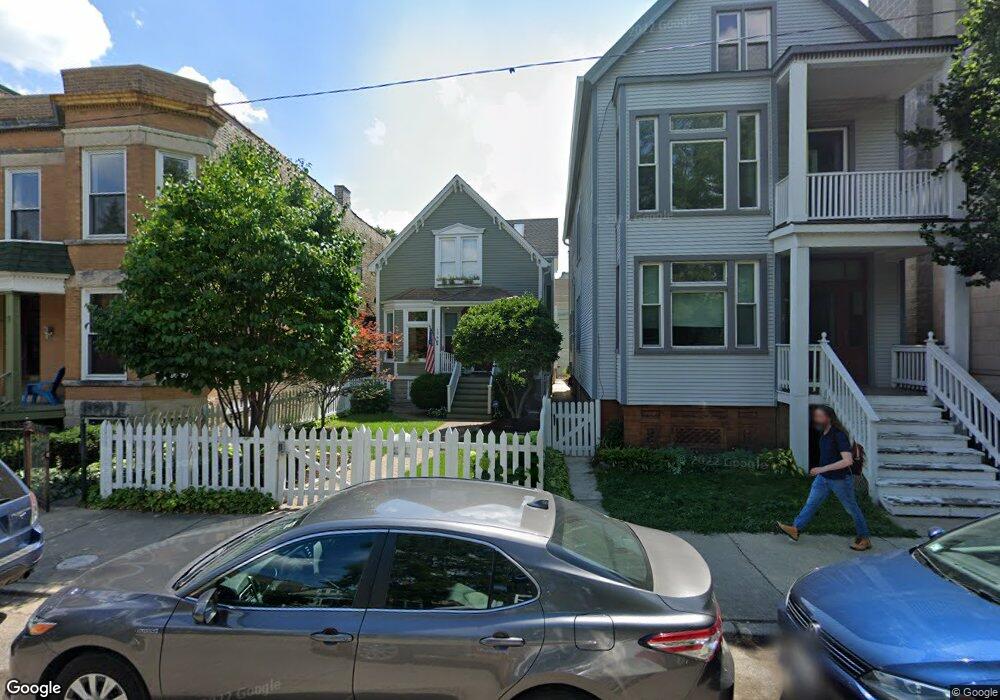
1709 W Henderson St Chicago, IL 60657
Southport Corridor NeighborhoodEstimated Value: $959,000 - $1,341,000
4
Beds
2
Baths
1,958
Sq Ft
$587/Sq Ft
Est. Value
About This Home
This home is located at 1709 W Henderson St, Chicago, IL 60657 and is currently estimated at $1,149,693, approximately $587 per square foot. 1709 W Henderson St is a home located in Cook County with nearby schools including Hamilton Elementary School, Lake View High School, and Saint Luke Academy.
Ownership History
Date
Name
Owned For
Owner Type
Purchase Details
Closed on
Aug 21, 2013
Sold by
Stewart John P and Stewart Amy C
Bought by
Stewart John P
Current Estimated Value
Purchase Details
Closed on
Jan 28, 2009
Sold by
Stewart John P
Bought by
Stewart John P and Stewart Amy C
Purchase Details
Closed on
May 28, 2004
Sold by
Mancini Michael D
Bought by
Stewart John P
Home Financials for this Owner
Home Financials are based on the most recent Mortgage that was taken out on this home.
Original Mortgage
$451,600
Outstanding Balance
$202,068
Interest Rate
4.75%
Mortgage Type
Unknown
Estimated Equity
$947,625
Purchase Details
Closed on
Dec 7, 1999
Sold by
Reedy William P and Reedy Emily B
Bought by
Mancini Michael D
Home Financials for this Owner
Home Financials are based on the most recent Mortgage that was taken out on this home.
Original Mortgage
$294,400
Interest Rate
7.75%
Create a Home Valuation Report for This Property
The Home Valuation Report is an in-depth analysis detailing your home's value as well as a comparison with similar homes in the area
Home Values in the Area
Average Home Value in this Area
Purchase History
| Date | Buyer | Sale Price | Title Company |
|---|---|---|---|
| Stewart John P | -- | Servicelink | |
| Stewart John P | -- | None Available | |
| Stewart John P | $564,500 | Ticor Title Insurance | |
| Mancini Michael D | $368,000 | -- |
Source: Public Records
Mortgage History
| Date | Status | Borrower | Loan Amount |
|---|---|---|---|
| Open | Stewart John P | $451,600 | |
| Previous Owner | Mancini Michael D | $294,400 |
Source: Public Records
Tax History Compared to Growth
Tax History
| Year | Tax Paid | Tax Assessment Tax Assessment Total Assessment is a certain percentage of the fair market value that is determined by local assessors to be the total taxable value of land and additions on the property. | Land | Improvement |
|---|---|---|---|---|
| 2024 | $13,408 | $80,765 | $40,176 | $40,589 |
| 2023 | $13,049 | $66,861 | $32,400 | $34,461 |
| 2022 | $13,049 | $66,861 | $32,400 | $34,461 |
| 2021 | $13,407 | $70,000 | $32,400 | $37,600 |
| 2020 | $14,182 | $66,764 | $14,515 | $52,249 |
| 2019 | $13,891 | $72,570 | $14,515 | $58,055 |
| 2018 | $13,656 | $72,570 | $14,515 | $58,055 |
| 2017 | $12,058 | $59,388 | $12,960 | $46,428 |
| 2016 | $11,395 | $59,388 | $12,960 | $46,428 |
| 2015 | $10,402 | $59,388 | $12,960 | $46,428 |
| 2014 | $9,171 | $52,000 | $10,368 | $41,632 |
| 2013 | $8,979 | $52,000 | $10,368 | $41,632 |
Source: Public Records
Map
Nearby Homes
- 3255 N Paulina St Unit 2B
- 1753 W Henderson St
- 1645 W School St Unit 418
- 3342 N Ravenswood Ave
- 1743 W Newport Ave
- 1623 W Melrose St Unit 501
- 1738 W Belmont Ave Unit 1R
- 3201 N Ravenswood Ave Unit 301
- 3438 N Ashland Ave Unit 2N
- 1753 W Cornelia Ave
- 1541 W Henderson St Unit D
- 3448 N Ashland Ave Unit 2S
- 3422 N Bosworth Ave Unit 1
- 3117 N Paulina St Unit G
- 3418 N Wolcott Ave Unit 1
- 3160 N Lincoln Ave Unit 310
- 3505 N Greenview Ave
- 1447 W Roscoe St Unit PH
- 1447 W Roscoe St Unit 1
- 1455 W Melrose St Unit 1
- 1705 W Henderson St
- 1705 W Henderson St Unit 2
- 1711 W Henderson St
- 1711 W Henderson St Unit G
- 1711 W Henderson St Unit 1
- 1711 W Henderson St Unit 3
- 1711 W Henderson St Unit 2
- 1703 W Henderson St
- 1701 W Henderson St
- 1717 W Henderson St Unit 1
- 1717 W Henderson St
- 3333 N Paulina St Unit 3S
- 1721 W Henderson St
- 1706 W School St
- 1710 W School St Unit 1
- 1710 W School St
- 1710 W School St Unit CH
- 1702 W School St Unit 1
- 1712 W School St
- 1712 W School St