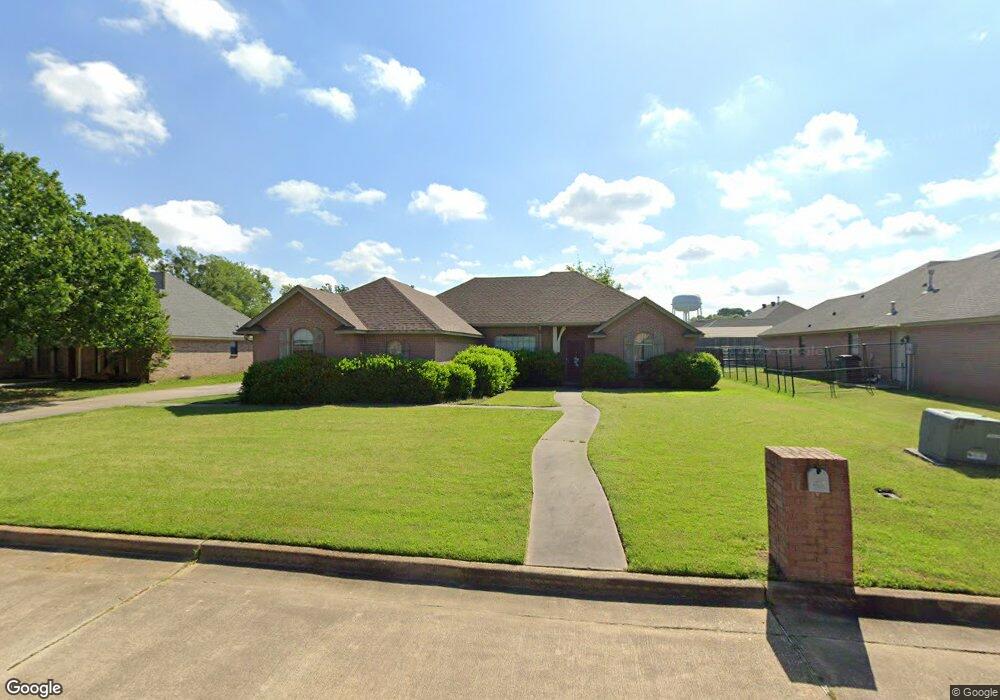
171 Corley Cir Wake Village, TX 75501
Estimated Value: $275,034 - $311,000
3
Beds
2
Baths
1,855
Sq Ft
$158/Sq Ft
Est. Value
About This Home
This home is located at 171 Corley Cir, Wake Village, TX 75501 and is currently estimated at $294,009, approximately $158 per square foot. 171 Corley Cir is a home located in Bowie County with nearby schools including Wake Village Elementary School, Texas Middle School, and Texas High School.
Ownership History
Date
Name
Owned For
Owner Type
Purchase Details
Closed on
Jun 6, 2019
Sold by
Barber Bernard L and Georgebarber Debra A
Bought by
Scott John Gregory and Powell Larissa
Current Estimated Value
Home Financials for this Owner
Home Financials are based on the most recent Mortgage that was taken out on this home.
Original Mortgage
$163,400
Outstanding Balance
$143,662
Interest Rate
4.2%
Mortgage Type
New Conventional
Estimated Equity
$150,347
Purchase Details
Closed on
May 16, 2006
Sold by
Hayes Bill and Hayes Mary
Bought by
Barber Bernard L and Georgebarber Debra A
Home Financials for this Owner
Home Financials are based on the most recent Mortgage that was taken out on this home.
Original Mortgage
$28,000
Interest Rate
6.5%
Mortgage Type
Credit Line Revolving
Create a Home Valuation Report for This Property
The Home Valuation Report is an in-depth analysis detailing your home's value as well as a comparison with similar homes in the area
Home Values in the Area
Average Home Value in this Area
Purchase History
| Date | Buyer | Sale Price | Title Company |
|---|---|---|---|
| Scott John Gregory | -- | Twin City Title | |
| Barber Bernard L | -- | None Available |
Source: Public Records
Mortgage History
| Date | Status | Borrower | Loan Amount |
|---|---|---|---|
| Open | Scott John Gregory | $163,400 | |
| Previous Owner | Barber Bernard L | $28,000 | |
| Previous Owner | Barber Bernard L | $112,000 |
Source: Public Records
Tax History Compared to Growth
Tax History
| Year | Tax Paid | Tax Assessment Tax Assessment Total Assessment is a certain percentage of the fair market value that is determined by local assessors to be the total taxable value of land and additions on the property. | Land | Improvement |
|---|---|---|---|---|
| 2025 | $5,366 | $275,730 | $23,000 | $252,730 |
| 2024 | $5,366 | $266,293 | $23,000 | $243,293 |
| 2023 | $5,406 | $267,881 | $20,000 | $247,881 |
| 2022 | $4,969 | $241,868 | $20,000 | $221,868 |
| 2021 | $4,321 | $195,025 | $20,000 | $175,025 |
| 2020 | $4,165 | $186,803 | $20,000 | $166,803 |
| 2019 | $4,409 | $189,555 | $20,000 | $169,555 |
| 2018 | $4,260 | $183,111 | $20,000 | $163,111 |
| 2017 | $3,868 | $166,792 | $20,000 | $146,792 |
| 2016 | $3,771 | $162,628 | $20,000 | $142,628 |
| 2015 | $3,618 | $161,244 | $20,000 | $141,244 |
| 2014 | $3,618 | $158,898 | $20,000 | $138,898 |
Source: Public Records
Map
Nearby Homes
- 416 W Greenfield Dr
- 122 Corley Cir
- 107 Lampasas Way
- 310 W Greenfield Dr
- 206 Pine Forest St
- 201 Pine Forest St
- 105 Eastline Rd
- 0 Brown Cir
- 216 W Pioneer St
- 2 Brown Acres
- 206 Redwater Rd
- 71 Macedonia Rd Unit 71 Macedonia RD
- 416 Edgewood Ln
- 5 Serenity Ln
- 404 Cody St
- 1103 N Kings Hwy
- 107 Berry Dr
- 502 Mitchell Ryan
- 244 Hickerson Ave
- 413 Central Ave
- 169 Corley Cir
- 173 Corley Cir
- 167 Corley Cir
- 172 Corley Cir
- 168 Corley Cir
- 38 Whitmarsh Place
- 165 Corley Cir Unit 1109
- 165 Corley Cir
- 174 Corley Cir
- 166 Corley Cir
- 162 Corley Cir
- 160 Corley Cir
- 163 Corley Cir
- 101 Corley Cir
- 158 Corley Cir
- 41 Whitmarsh Place
- 100 Corley Cir
- 102 Corley Cir
- 415 W Greenfield Dr
- 156 Corley Cir