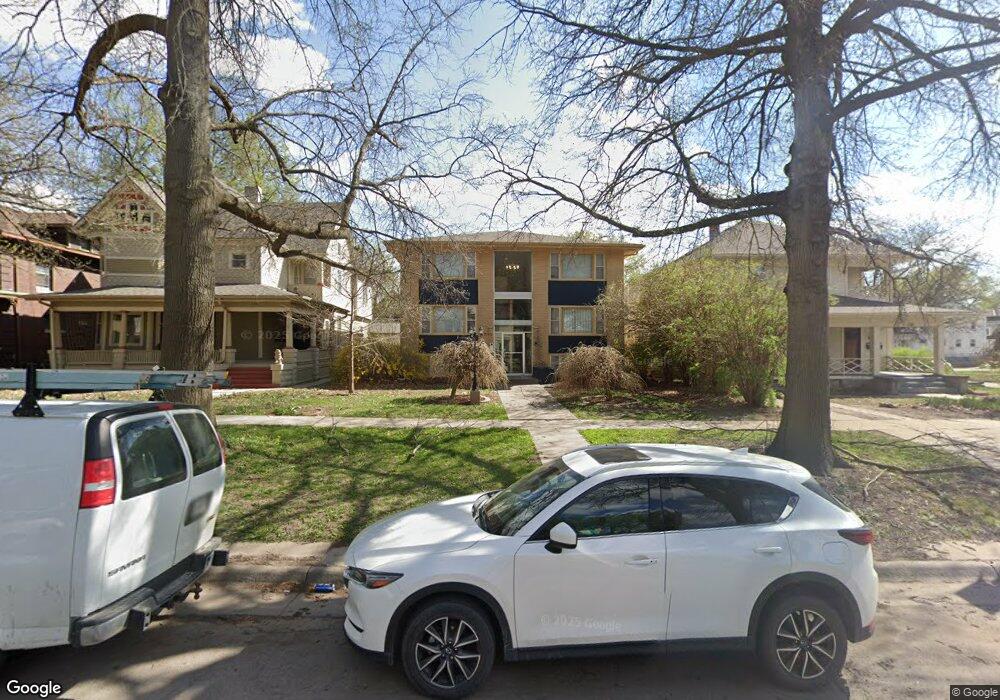
1711 D St Lincoln, NE 68502
Near South NeighborhoodEstimated Value: $372,660
1
Bed
1
Bath
640
Sq Ft
$582/Sq Ft
Est. Value
About This Home
This home is located at 1711 D St, Lincoln, NE 68502 and is currently estimated at $372,660, approximately $582 per square foot. 1711 D St is a home located in Lancaster County with nearby schools including McPhee Elementary School, Park Middle School, and Lincoln High School.
Ownership History
Date
Name
Owned For
Owner Type
Purchase Details
Closed on
Jun 25, 2020
Sold by
Fahrenbruck Ricke Scott and Dick William Dwight
Bought by
Koll Investmetns Properties Llc
Current Estimated Value
Home Financials for this Owner
Home Financials are based on the most recent Mortgage that was taken out on this home.
Original Mortgage
$250,000
Interest Rate
3.1%
Mortgage Type
Unknown
Create a Home Valuation Report for This Property
The Home Valuation Report is an in-depth analysis detailing your home's value as well as a comparison with similar homes in the area
Home Values in the Area
Average Home Value in this Area
Purchase History
| Date | Buyer | Sale Price | Title Company |
|---|---|---|---|
| Koll Investmetns Properties Llc | $260,000 | Charter T&E Svcs Inc |
Source: Public Records
Mortgage History
| Date | Status | Borrower | Loan Amount |
|---|---|---|---|
| Closed | Koll Investmetns Properties Llc | $250,000 |
Source: Public Records
Tax History Compared to Growth
Tax History
| Year | Tax Paid | Tax Assessment Tax Assessment Total Assessment is a certain percentage of the fair market value that is determined by local assessors to be the total taxable value of land and additions on the property. | Land | Improvement |
|---|---|---|---|---|
| 2025 | $5,622 | $422,400 | $32,400 | $390,000 |
| 2024 | $5,622 | $403,300 | $45,000 | $358,300 |
| 2023 | $6,456 | $385,200 | $45,000 | $340,200 |
| 2022 | $6,653 | $333,800 | $45,000 | $288,800 |
| 2021 | $5,300 | $281,100 | $45,000 | $236,100 |
| 2020 | $4,076 | $213,300 | $45,000 | $168,300 |
| 2019 | $4,076 | $213,300 | $45,000 | $168,300 |
| 2018 | $4,094 | $213,300 | $45,000 | $168,300 |
| 2017 | $3,942 | $203,500 | $45,000 | $158,500 |
| 2016 | $3,963 | $203,500 | $45,000 | $158,500 |
| 2015 | $3,935 | $203,500 | $45,000 | $158,500 |
| 2014 | $3,773 | $194,000 | $32,400 | $161,600 |
| 2013 | -- | $194,000 | $32,400 | $161,600 |
Source: Public Records
Map
Nearby Homes