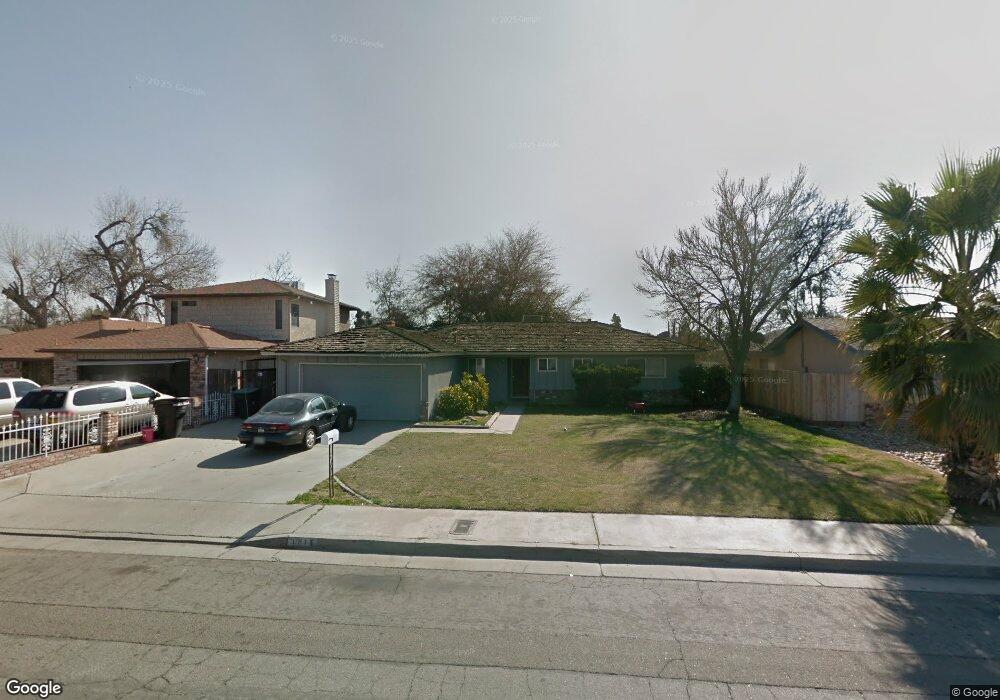
1711 W Kanai Ave Porterville, CA 93257
Porterville Northwest NeighborhoodEstimated Value: $303,760 - $337,000
3
Beds
2
Baths
1,410
Sq Ft
$227/Sq Ft
Est. Value
About This Home
This home is located at 1711 W Kanai Ave, Porterville, CA 93257 and is currently estimated at $320,440, approximately $227 per square foot. 1711 W Kanai Ave is a home located in Tulare County with nearby schools including Jim Maples Academy, Burton Middle School, and Monache High School.
Ownership History
Date
Name
Owned For
Owner Type
Purchase Details
Closed on
Jun 27, 2016
Sold by
Owen Robert J
Bought by
Owen Robert James and Owen Lueslie Ann
Current Estimated Value
Purchase Details
Closed on
Sep 26, 2008
Sold by
Owen Robert J
Bought by
Owen Robert J and Robert J Owen Separate Property Trust
Purchase Details
Closed on
May 9, 2006
Sold by
Owen Robert J
Bought by
Owen Robert J
Purchase Details
Closed on
Aug 2, 2005
Sold by
Owen Robert J
Bought by
Owen Robert J and Owen Lu Eslie Ann
Purchase Details
Closed on
Apr 8, 2003
Sold by
Stackpole Alex
Bought by
Owen Robert J and Owen Lueslie Ann
Purchase Details
Closed on
Nov 2, 2000
Sold by
Creekmore George E
Bought by
Stackpole Alex C and Stackpole Spencer Morgan
Home Financials for this Owner
Home Financials are based on the most recent Mortgage that was taken out on this home.
Original Mortgage
$71,950
Interest Rate
7.66%
Purchase Details
Closed on
Mar 11, 1997
Sold by
Creekmore Lisa
Bought by
Creekmore George E
Create a Home Valuation Report for This Property
The Home Valuation Report is an in-depth analysis detailing your home's value as well as a comparison with similar homes in the area
Home Values in the Area
Average Home Value in this Area
Purchase History
| Date | Buyer | Sale Price | Title Company |
|---|---|---|---|
| Owen Robert James | -- | None Available | |
| Owen Robert J | -- | None Available | |
| Owen Robert J | -- | Chicago Title Co | |
| Owen Robert J | -- | Chicago Title Co | |
| Owen Robert J | $78,437 | Fidelity National Title | |
| Stackpole Alex C | $90,000 | Chicago Title Co | |
| Creekmore George E | -- | -- |
Source: Public Records
Mortgage History
| Date | Status | Borrower | Loan Amount |
|---|---|---|---|
| Previous Owner | Stackpole Alex C | $71,950 |
Source: Public Records
Tax History Compared to Growth
Tax History
| Year | Tax Paid | Tax Assessment Tax Assessment Total Assessment is a certain percentage of the fair market value that is determined by local assessors to be the total taxable value of land and additions on the property. | Land | Improvement |
|---|---|---|---|---|
| 2025 | $1,293 | $123,108 | $36,207 | $86,901 |
| 2024 | $1,293 | $120,696 | $35,498 | $85,198 |
| 2023 | $1,297 | $118,330 | $34,802 | $83,528 |
| 2022 | $1,247 | $116,011 | $34,120 | $81,891 |
| 2021 | $1,228 | $113,736 | $33,451 | $80,285 |
| 2020 | $1,205 | $112,570 | $33,108 | $79,462 |
| 2019 | $1,205 | $110,363 | $32,459 | $77,904 |
| 2018 | $1,151 | $108,199 | $31,823 | $76,376 |
| 2017 | $1,133 | $106,077 | $31,199 | $74,878 |
| 2016 | $1,080 | $103,997 | $30,587 | $73,410 |
| 2015 | $1,041 | $102,435 | $30,128 | $72,307 |
| 2014 | $1,041 | $100,429 | $29,538 | $70,891 |
Source: Public Records
Map
Nearby Homes
- 1730 W Grand Ave
- 595 N Salisbury St
- 1690 Memory Ln
- 1771 W Aurora Ct
- 1644 Mccomb Ave
- 1691 Terry Ct
- 1750 W Terry Cir
- 2070 W Harrison Ave
- 1343 W Morton Ave Unit Sp 84
- 313 Balmoral Dr
- 1041 Greenfield Dr
- 251301037 Tomah Ave
- 1482 Tomah Ave
- 700 N Prospect St
- 640 N Prospect St
- 1681 W Wall Ln
- 1076 N Beverly St
- 1857 W Westfield Ave
- 2300 W Morton Ave Unit 163
- 2300 W Morton Ave Unit 22
- 1701 W Kanai Ave
- 1721 W Kanai Ave
- 1691 W Kanai Ave
- 1731 W Kanai Ave
- 1710 W Kanai Ave
- 1720 W Kanai Ave
- 1681 W Kanai Ave
- 1690 W Kanai Ave
- 1740 W Belleview Ave
- 1712 W Belleview Ct
- 1712 Belleview Ct
- 1722 W Belleview Ave
- 1704 Belleview Ct
- 1680 W Kanai Ave
- 1711 W Grand Ave
- 1740 W Kanai Ave
- 1730 W Belleview Ave
- 1701 W Grand Ave
- 1750 Belleview Ct
- 1671 W Kanai Ave Unit 1