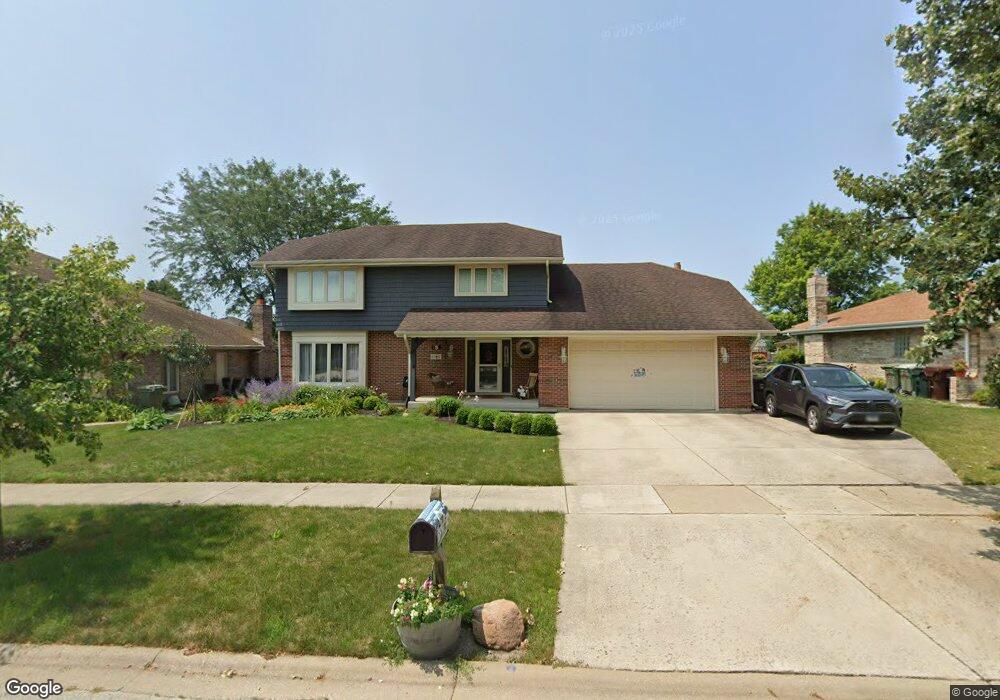
17110 Fox Grove Ln Tinley Park, IL 60487
Central Tinley Park NeighborhoodEstimated Value: $442,000 - $502,000
4
Beds
3
Baths
2,279
Sq Ft
$206/Sq Ft
Est. Value
About This Home
This home is located at 17110 Fox Grove Ln, Tinley Park, IL 60487 and is currently estimated at $468,465, approximately $205 per square foot. 17110 Fox Grove Ln is a home located in Cook County with nearby schools including Christa Mcauliffe School, Prairie View Middle School, and Victor J Andrew High School.
Ownership History
Date
Name
Owned For
Owner Type
Purchase Details
Closed on
Feb 26, 2020
Sold by
Koran James E and Koran Nancy L
Bought by
Koran James E and Koran Nancy L
Current Estimated Value
Create a Home Valuation Report for This Property
The Home Valuation Report is an in-depth analysis detailing your home's value as well as a comparison with similar homes in the area
Home Values in the Area
Average Home Value in this Area
Purchase History
| Date | Buyer | Sale Price | Title Company |
|---|---|---|---|
| Koran James E | -- | Attorney |
Source: Public Records
Tax History Compared to Growth
Tax History
| Year | Tax Paid | Tax Assessment Tax Assessment Total Assessment is a certain percentage of the fair market value that is determined by local assessors to be the total taxable value of land and additions on the property. | Land | Improvement |
|---|---|---|---|---|
| 2024 | $9,171 | $39,001 | $5,693 | $33,308 |
| 2023 | $8,488 | $39,001 | $5,693 | $33,308 |
| 2022 | $8,488 | $29,966 | $4,950 | $25,016 |
| 2021 | $9,190 | $29,965 | $4,950 | $25,015 |
| 2020 | $9,028 | $29,965 | $4,950 | $25,015 |
| 2019 | $8,692 | $30,230 | $4,455 | $25,775 |
| 2018 | $8,504 | $30,230 | $4,455 | $25,775 |
| 2017 | $8,296 | $30,230 | $4,455 | $25,775 |
| 2016 | $7,911 | $26,316 | $3,960 | $22,356 |
| 2015 | $7,785 | $26,316 | $3,960 | $22,356 |
| 2014 | $7,736 | $26,316 | $3,960 | $22,356 |
| 2013 | $7,508 | $27,490 | $3,960 | $23,530 |
Source: Public Records
Map
Nearby Homes
- 8548 Bethany Ln
- 17155 Kamp Ct Unit 9
- 8543 Carriage Ln
- 8456 170th Place
- 8444 W 171st St
- 17324 Humber Ln
- 8721 W 169th St
- 8229 170th St Unit 8229
- 16933 Richards Dr
- 8750 W 169th St
- 8710 W 168th St
- Fremont Plan at Radcliffe Place
- Calysta Plan at Radcliffe Place
- Danbury Plan at Radcliffe Place
- Briarcliffe Plan at Radcliffe Place
- Eden Plan at Radcliffe Place
- Amberwood Plan at Radcliffe Place
- 8313 Aster Ln
- 17230 Shetland Dr
- 17003 Grissom Dr Unit 2N
- 17120 Fox Grove Ln
- 17100 Fox Grove Ln
- 17119 Bethany Ln
- 17130 Fox Grove Ln
- 17113 Bethany Ln
- 17125 Bethany Ln
- 8501 171st St
- 17115 Fox Grove Ln
- 17140 Fox Grove Ln
- 17131 Bethany Ln
- 17125 Fox Grove Ln
- 8536 171st Place
- 17137 Bethany Ln Unit 2
- 17135 Fox Grove Ln
- 17049 Cherry Creek Ave
- 17150 Fox Grove Ln
- 8507 170th Place
- 8501 170th Place
- 8542 171st Place
- 8513 170th Place