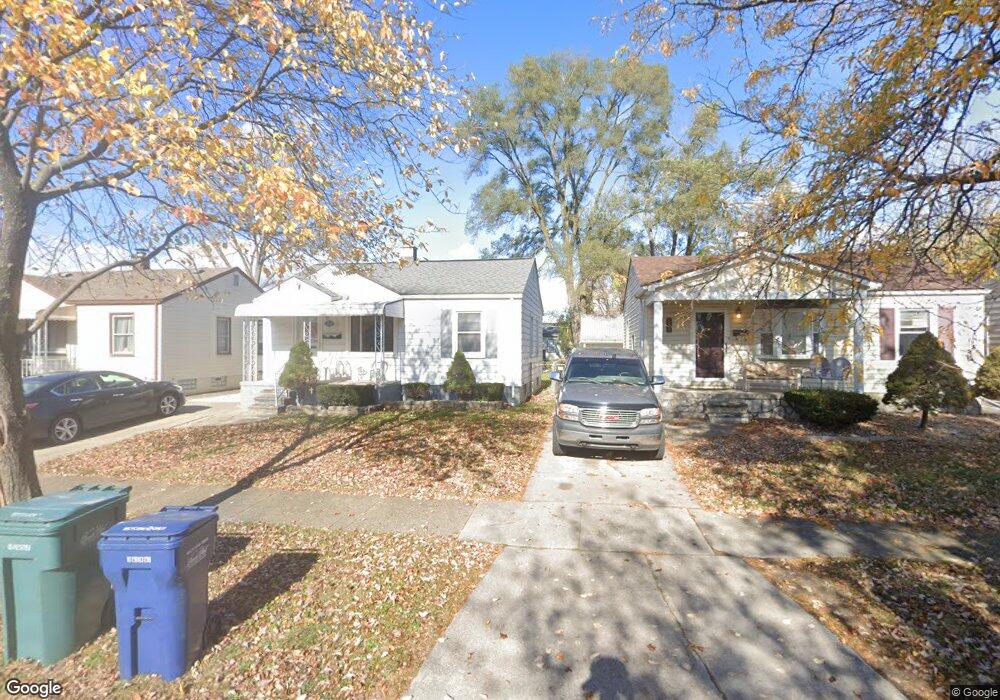
1712 Progress Ave Lincoln Park, MI 48146
Estimated Value: $129,526 - $161,000
--
Bed
1
Bath
690
Sq Ft
$211/Sq Ft
Est. Value
About This Home
This home is located at 1712 Progress Ave, Lincoln Park, MI 48146 and is currently estimated at $145,632, approximately $211 per square foot. 1712 Progress Ave is a home located in Wayne County with nearby schools including James Foote School, Lincoln Park Middle School, and Lincoln Park High School.
Ownership History
Date
Name
Owned For
Owner Type
Purchase Details
Closed on
Dec 27, 2018
Sold by
Fisher Jerry K and Fisher Teresa L
Bought by
Fisher Joshua L
Current Estimated Value
Purchase Details
Closed on
Nov 3, 2015
Sold by
Fisher Jerry K and Fisher Teresa L
Bought by
The Jerry K Fisher & Teresa L Fisher Rev
Purchase Details
Closed on
Nov 29, 2010
Sold by
Wojtowicz Raymond J
Bought by
Fisher Jerry K
Purchase Details
Closed on
Apr 17, 2007
Sold by
Woolsey Richard and Woolsey Rebecca
Bought by
Ramsey Tyrus
Purchase Details
Closed on
Dec 4, 2006
Sold by
Va
Bought by
Woolsey Richard
Purchase Details
Closed on
Sep 15, 2005
Sold by
Abn Amro Mortgage Group Inc
Bought by
Va
Purchase Details
Closed on
Aug 24, 2005
Sold by
Stram Nicholas C and Stram Bernadette
Bought by
Abn Amro Mortgage Group Inc
Purchase Details
Closed on
Jan 26, 2001
Sold by
Lemay James J
Bought by
Stram Nicholas
Purchase Details
Closed on
Oct 24, 1997
Sold by
Annette C and Annette Jeffrey M
Bought by
Joseph M and Lemay Virginia R
Create a Home Valuation Report for This Property
The Home Valuation Report is an in-depth analysis detailing your home's value as well as a comparison with similar homes in the area
Home Values in the Area
Average Home Value in this Area
Purchase History
| Date | Buyer | Sale Price | Title Company |
|---|---|---|---|
| Fisher Joshua L | -- | None Available | |
| The Jerry K Fisher & Teresa L Fisher Rev | -- | Attorney | |
| Fisher Jerry K | $11,500 | None Available | |
| Ramsey Tyrus | $129,000 | Lts Title Agency | |
| Woolsey Richard | -- | Metro Title Corp | |
| Va | -- | None Available | |
| Abn Amro Mortgage Group Inc | $85,487 | None Available | |
| Stram Nicholas | $88,500 | -- | |
| Joseph M | $71,500 | -- |
Source: Public Records
Tax History Compared to Growth
Tax History
| Year | Tax Paid | Tax Assessment Tax Assessment Total Assessment is a certain percentage of the fair market value that is determined by local assessors to be the total taxable value of land and additions on the property. | Land | Improvement |
|---|---|---|---|---|
| 2025 | $1,163 | $58,100 | $0 | $0 |
| 2024 | $1,163 | $52,700 | $0 | $0 |
| 2023 | $1,248 | $49,900 | $0 | $0 |
| 2022 | $1,301 | $42,900 | $0 | $0 |
| 2021 | $1,274 | $32,900 | $0 | $0 |
| 2020 | $1,263 | $28,600 | $0 | $0 |
| 2019 | $1,412 | $27,000 | $0 | $0 |
| 2018 | $1,303 | $22,200 | $0 | $0 |
| 2017 | $674 | $22,400 | $0 | $0 |
| 2016 | $1,563 | $22,300 | $0 | $0 |
| 2015 | $2,150 | $21,500 | $0 | $0 |
| 2013 | $2,220 | $23,100 | $0 | $0 |
| 2012 | $1,859 | $23,900 | $5,700 | $18,200 |
Source: Public Records
Map
Nearby Homes
- 2932 Green St
- 1805 Rose Ave
- 1571 Progress Ave
- 1623 Mayflower Ave
- LOT 398 Dix Hwy
- 1554 London Ave
- 1424 Mayflower Ave
- 2159 Detroit Ave
- 1565 Richmond Ave
- 2209 Progress Ave
- 2660 Bailey Ave
- 1771 Stewart Ave
- 1608 Stewart Ave
- 1590 Mill St
- 2910 Bailey Ave
- 1741 Cleveland Ave
- 1860 Pagel Ave
- 1673 Pagel Ave
- 1665 Pagel Ave
- 1837 Pagel Ave
- 1708 Progress Ave
- 1716 Progress Ave
- 1704 Progress Ave
- 1724 Progress Ave
- 1728 Progress Ave
- 1717 Rose Ave
- 1713 Rose Ave
- 1725 Rose Ave
- 1709 Rose Ave
- 1732 Progress Ave
- 1729 Rose Ave
- 1705 Rose Ave
- 1733 Rose Ave
- 1717 Progress Ave
- 1713 Progress Ave
- 1725 Progress Ave
- 1709 Progress Ave
- 1729 Progress Ave
- 1737 Rose Ave
- 1705 Progress Ave