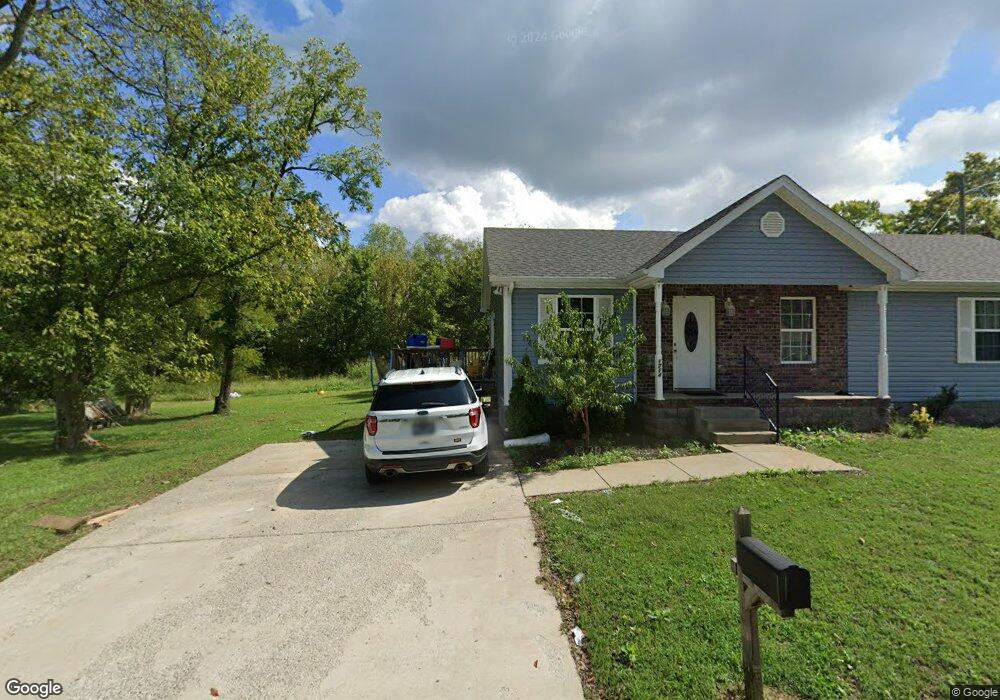
1714 Park St Springfield, TN 37172
Estimated Value: $230,000 - $289,000
--
Bed
--
Bath
1,152
Sq Ft
$221/Sq Ft
Est. Value
About This Home
This home is located at 1714 Park St, Springfield, TN 37172 and is currently estimated at $254,515, approximately $220 per square foot. 1714 Park St is a home with nearby schools including Cheatham Park Elementary School, Westside Elementary School, and Innovation Academy.
Ownership History
Date
Name
Owned For
Owner Type
Purchase Details
Closed on
Jan 10, 2019
Sold by
Krantz Carl D
Bought by
Harlow Donnie and Harlow Danielle
Current Estimated Value
Purchase Details
Closed on
Jun 15, 2016
Sold by
Gre Llc
Bought by
Krantz Carl D
Purchase Details
Closed on
Sep 27, 2012
Sold by
Benton Hillary E
Bought by
Gre Llc
Purchase Details
Closed on
Dec 30, 2008
Bought by
Benton Hillary E
Purchase Details
Closed on
May 14, 2004
Bought by
Gainous Brian
Purchase Details
Closed on
Nov 6, 1997
Sold by
Lee Wilson Robert
Bought by
Lee Jackson Buddy
Home Financials for this Owner
Home Financials are based on the most recent Mortgage that was taken out on this home.
Original Mortgage
$14,500
Interest Rate
8%
Purchase Details
Closed on
Sep 22, 1978
Bought by
Wilson Robert Lee
Purchase Details
Closed on
Jan 1, 1978
Create a Home Valuation Report for This Property
The Home Valuation Report is an in-depth analysis detailing your home's value as well as a comparison with similar homes in the area
Home Values in the Area
Average Home Value in this Area
Purchase History
| Date | Buyer | Sale Price | Title Company |
|---|---|---|---|
| Harlow Donnie | -- | None Available | |
| Krantz Carl D | -- | -- | |
| Gre Llc | -- | -- | |
| Benton Hillary E | -- | -- | |
| Gainous Brian | $3,800 | -- | |
| Lee Jackson Buddy | $15,000 | -- | |
| Wilson Robert Lee | -- | -- | |
| -- | $8,000 | -- |
Source: Public Records
Mortgage History
| Date | Status | Borrower | Loan Amount |
|---|---|---|---|
| Previous Owner | Not Available | $14,500 |
Source: Public Records
Tax History Compared to Growth
Tax History
| Year | Tax Paid | Tax Assessment Tax Assessment Total Assessment is a certain percentage of the fair market value that is determined by local assessors to be the total taxable value of land and additions on the property. | Land | Improvement |
|---|---|---|---|---|
| 2024 | -- | $60,650 | $18,750 | $41,900 |
| 2023 | $1,520 | $60,650 | $18,750 | $41,900 |
| 2022 | $1,234 | $33,825 | $2,750 | $31,075 |
| 2021 | $1,234 | $33,825 | $2,750 | $31,075 |
| 2020 | $1,234 | $33,825 | $2,750 | $31,075 |
| 2019 | $18,841 | $33,825 | $2,750 | $31,075 |
| 2018 | $167 | $4,600 | $2,750 | $1,850 |
| 2017 | $156 | $3,625 | $1,975 | $1,650 |
| 2016 | $156 | $3,625 | $1,975 | $1,650 |
| 2015 | $151 | $3,625 | $1,975 | $1,650 |
| 2014 | $158 | $3,800 | $1,975 | $1,825 |
Source: Public Records
Map
Nearby Homes
- 203 15th Ave E
- 596 18th Ave W
- 205 18th Ave W
- 2222 Leota St
- 1505 Cheatham St
- 206 15th Ave W
- 208 15th Ave W
- 2067 Bessie St
- 0 Bessie St
- 629 E 17th Ave
- 633 E 17th Ave
- 1 W 20th Ave
- 168 Dorris Ave
- 3166 John L Patterson St
- 120 23rd Ave E
- 413 Dorris Ave
- 115 23rd Ave E
- 1603 Mantlo St
- 732 Shelby Lynn Dr
- 109 E 7th Ave