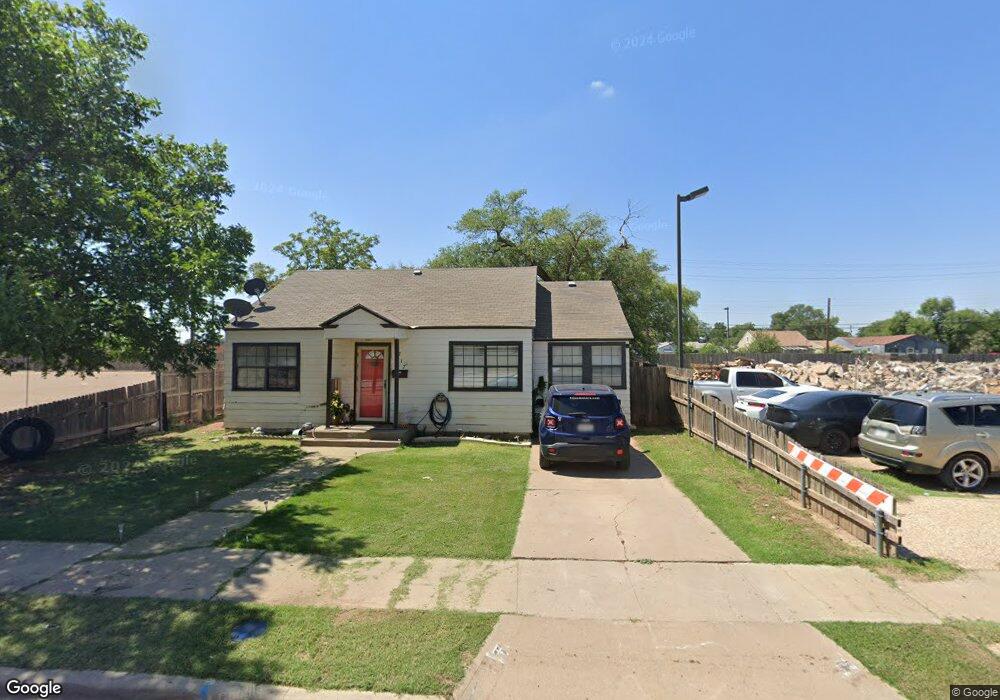
1717 21st St Lubbock, TX 79411
Heart of Lubbock NeighborhoodEstimated Value: $89,000 - $122,000
2
Beds
1
Bath
1,074
Sq Ft
$100/Sq Ft
Est. Value
About This Home
This home is located at 1717 21st St, Lubbock, TX 79411 and is currently estimated at $107,767, approximately $100 per square foot. 1717 21st St is a home located in Lubbock County with nearby schools including Dupre Elementary School, Slaton Middle School, and Monterey High School.
Ownership History
Date
Name
Owned For
Owner Type
Purchase Details
Closed on
Nov 30, 2010
Sold by
Fox Robert Lee
Bought by
Vincent Shayne
Current Estimated Value
Home Financials for this Owner
Home Financials are based on the most recent Mortgage that was taken out on this home.
Original Mortgage
$35,000
Outstanding Balance
$523
Interest Rate
4.22%
Mortgage Type
Construction
Estimated Equity
$107,244
Purchase Details
Closed on
Nov 1, 1993
Sold by
Rogers Bettye
Bought by
Vincent Shayne
Purchase Details
Closed on
Jan 31, 1992
Sold by
Rogers Bettye
Bought by
Vincent Shayne
Create a Home Valuation Report for This Property
The Home Valuation Report is an in-depth analysis detailing your home's value as well as a comparison with similar homes in the area
Home Values in the Area
Average Home Value in this Area
Purchase History
| Date | Buyer | Sale Price | Title Company |
|---|---|---|---|
| Vincent Shayne | -- | Service Title | |
| Vincent Shayne | -- | -- | |
| Vincent Shayne | -- | -- |
Source: Public Records
Mortgage History
| Date | Status | Borrower | Loan Amount |
|---|---|---|---|
| Open | Vincent Shayne | $35,000 |
Source: Public Records
Tax History Compared to Growth
Tax History
| Year | Tax Paid | Tax Assessment Tax Assessment Total Assessment is a certain percentage of the fair market value that is determined by local assessors to be the total taxable value of land and additions on the property. | Land | Improvement |
|---|---|---|---|---|
| 2025 | $1,456 | $86,473 | $25,000 | $61,473 |
| 2024 | $1,456 | $86,473 | $25,000 | $61,473 |
| 2023 | $1,242 | $66,826 | $12,804 | $54,022 |
| 2022 | $1,149 | $56,761 | $12,804 | $43,957 |
| 2021 | $1,048 | $48,932 | $12,804 | $36,128 |
| 2020 | $1,076 | $49,496 | $12,804 | $36,692 |
| 2019 | $1,062 | $47,301 | $12,804 | $34,497 |
| 2018 | $1,099 | $48,869 | $12,804 | $36,065 |
| 2017 | $1,041 | $46,234 | $2,580 | $43,654 |
| 2016 | $1,024 | $45,482 | $2,580 | $42,902 |
| 2015 | $845 | $38,000 | $2,580 | $35,420 |
| 2014 | $845 | $38,000 | $2,580 | $35,420 |
Source: Public Records
Map
Nearby Homes