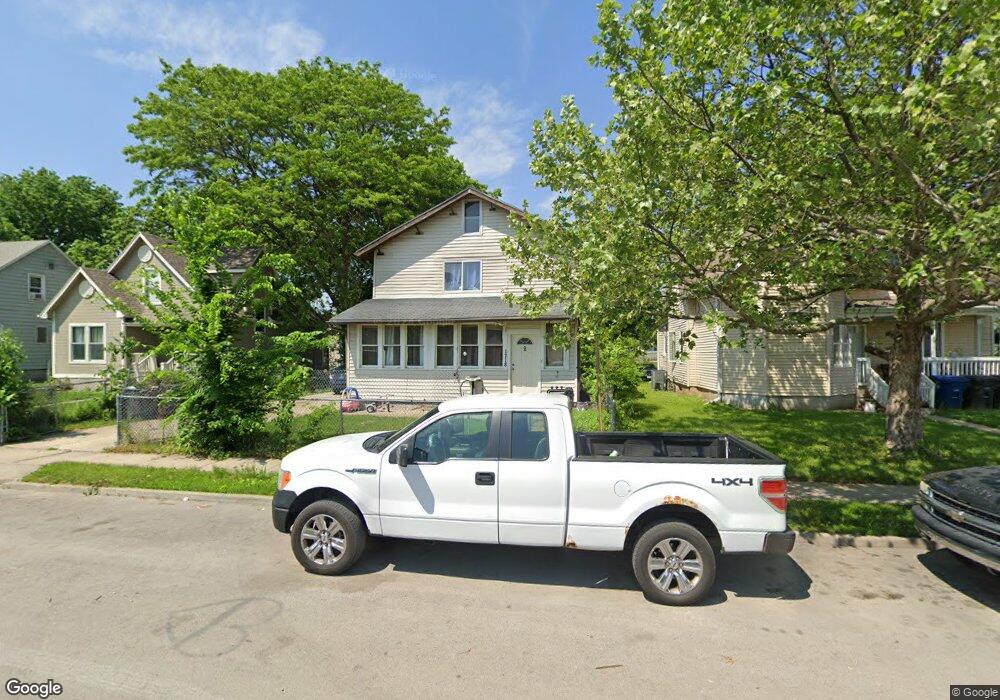
1718 11th St Des Moines, IA 50314
King Irving NeighborhoodEstimated Value: $152,235 - $204,000
4
Beds
2
Baths
1,872
Sq Ft
$95/Sq Ft
Est. Value
About This Home
This home is located at 1718 11th St, Des Moines, IA 50314 and is currently estimated at $178,559, approximately $95 per square foot. 1718 11th St is a home located in Polk County with nearby schools including Moulton Elementary School, Harding Middle School, and North High School.
Ownership History
Date
Name
Owned For
Owner Type
Purchase Details
Closed on
Sep 13, 2010
Sold by
Perez Noe
Bought by
Ramos Lopez Omar
Current Estimated Value
Home Financials for this Owner
Home Financials are based on the most recent Mortgage that was taken out on this home.
Original Mortgage
$58,180
Outstanding Balance
$37,894
Interest Rate
4.25%
Mortgage Type
FHA
Estimated Equity
$140,665
Purchase Details
Closed on
Apr 21, 2008
Sold by
Wells Fargo Bank Na
Bought by
Perez Noe
Purchase Details
Closed on
Apr 9, 2008
Sold by
Wells Fargo Bank Na
Bought by
Perez Noe
Purchase Details
Closed on
Sep 14, 2006
Sold by
Carter Lela R and Carter Jimmy
Bought by
Carter Jimmy and Carter Lela R
Purchase Details
Closed on
Jan 13, 1998
Sold by
Cavan Ding
Bought by
Loon Khambanoun
Create a Home Valuation Report for This Property
The Home Valuation Report is an in-depth analysis detailing your home's value as well as a comparison with similar homes in the area
Home Values in the Area
Average Home Value in this Area
Purchase History
| Date | Buyer | Sale Price | Title Company |
|---|---|---|---|
| Ramos Lopez Omar | $58,500 | None Available | |
| Perez Noe | $14,500 | None Available | |
| Perez Noe | $14,500 | None Available | |
| Carter Jimmy | -- | None Available | |
| Loon Khambanoun | -- | -- |
Source: Public Records
Mortgage History
| Date | Status | Borrower | Loan Amount |
|---|---|---|---|
| Open | Ramos Lopez Omar | $58,180 |
Source: Public Records
Tax History Compared to Growth
Tax History
| Year | Tax Paid | Tax Assessment Tax Assessment Total Assessment is a certain percentage of the fair market value that is determined by local assessors to be the total taxable value of land and additions on the property. | Land | Improvement |
|---|---|---|---|---|
| 2025 | $1,584 | $106,200 | $13,700 | $92,500 |
| 2024 | $1,584 | $91,000 | $11,700 | $79,300 |
| 2023 | $1,370 | $91,000 | $11,700 | $79,300 |
| 2022 | $1,358 | $67,000 | $8,900 | $58,100 |
| 2021 | $1,260 | $67,000 | $8,900 | $58,100 |
| 2020 | $1,304 | $59,100 | $7,900 | $51,200 |
| 2019 | $1,206 | $59,100 | $7,900 | $51,200 |
| 2018 | $1,188 | $53,400 | $7,100 | $46,300 |
| 2017 | $1,450 | $53,400 | $7,100 | $46,300 |
| 2016 | $1,182 | $53,600 | $7,000 | $46,600 |
| 2015 | $1,182 | $53,600 | $7,000 | $46,600 |
| 2014 | $1,078 | $49,300 | $7,200 | $42,100 |
Source: Public Records
Map
Nearby Homes