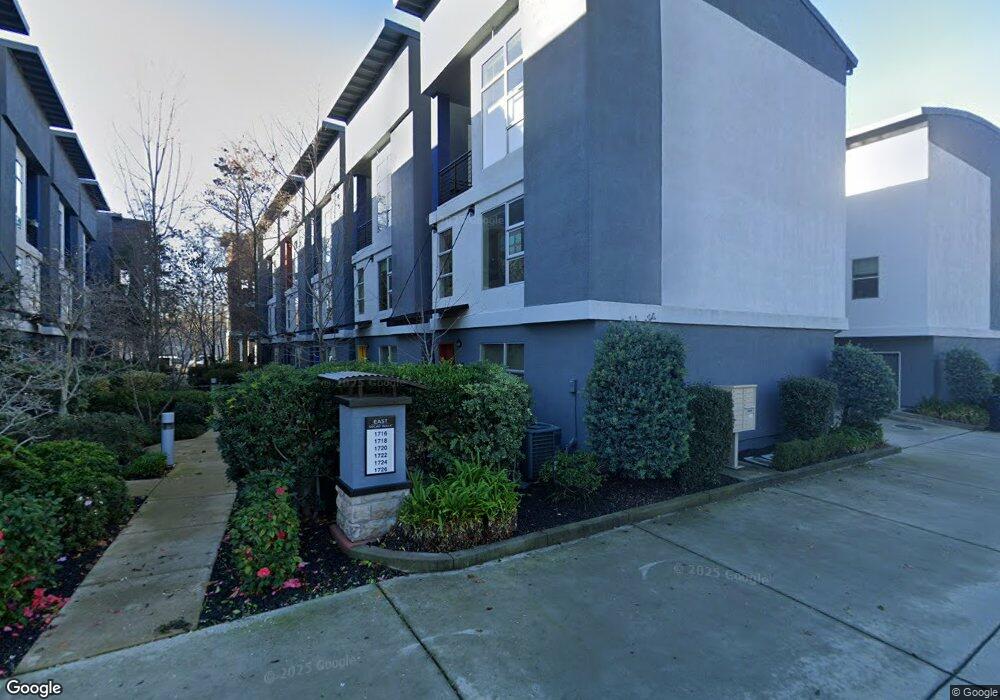
1718 E Socap Walk Sacramento, CA 95811
Downtown Sacramento NeighborhoodEstimated Value: $515,000 - $596,000
2
Beds
3
Baths
699
Sq Ft
$803/Sq Ft
Est. Value
About This Home
This home is located at 1718 E Socap Walk, Sacramento, CA 95811 and is currently estimated at $561,043, approximately $802 per square foot. 1718 E Socap Walk is a home located in Sacramento County with nearby schools including William Land Elementary School, Miwok Middle School, and C. K. McClatchy High.
Ownership History
Date
Name
Owned For
Owner Type
Purchase Details
Closed on
Oct 30, 2020
Sold by
Tsang Derrick
Bought by
Tsang Derrick and Fong Tsang Trust
Current Estimated Value
Home Financials for this Owner
Home Financials are based on the most recent Mortgage that was taken out on this home.
Original Mortgage
$271,500
Outstanding Balance
$193,321
Interest Rate
2.8%
Mortgage Type
New Conventional
Estimated Equity
$367,722
Purchase Details
Closed on
Sep 15, 2020
Sold by
Tsang Derrick
Bought by
Tsang Derrick
Home Financials for this Owner
Home Financials are based on the most recent Mortgage that was taken out on this home.
Original Mortgage
$271,500
Outstanding Balance
$193,321
Interest Rate
2.8%
Mortgage Type
New Conventional
Estimated Equity
$367,722
Purchase Details
Closed on
Jul 13, 2008
Sold by
Socap Lofts Sacramento Llc
Bought by
Tsang Derrick
Home Financials for this Owner
Home Financials are based on the most recent Mortgage that was taken out on this home.
Original Mortgage
$325,450
Interest Rate
6.41%
Mortgage Type
Purchase Money Mortgage
Create a Home Valuation Report for This Property
The Home Valuation Report is an in-depth analysis detailing your home's value as well as a comparison with similar homes in the area
Home Values in the Area
Average Home Value in this Area
Purchase History
| Date | Buyer | Sale Price | Title Company |
|---|---|---|---|
| Tsang Derrick | -- | None Available | |
| Tsang Derrick | -- | Stewart Title Guaranty Co | |
| Tsang Derrick | -- | Stewart Title Guaranty Co | |
| Tsang Derrick | $407,000 | None Available |
Source: Public Records
Mortgage History
| Date | Status | Borrower | Loan Amount |
|---|---|---|---|
| Open | Tsang Derrick | $271,500 | |
| Closed | Tsang Derrick | $325,450 |
Source: Public Records
Tax History Compared to Growth
Tax History
| Year | Tax Paid | Tax Assessment Tax Assessment Total Assessment is a certain percentage of the fair market value that is determined by local assessors to be the total taxable value of land and additions on the property. | Land | Improvement |
|---|---|---|---|---|
| 2025 | $6,188 | $523,878 | $321,933 | $201,945 |
| 2024 | $6,188 | $513,607 | $315,621 | $197,986 |
| 2023 | $6,040 | $503,537 | $309,433 | $194,104 |
| 2022 | $5,935 | $493,665 | $303,366 | $190,299 |
| 2021 | $5,654 | $483,986 | $297,418 | $186,568 |
| 2020 | $5,700 | $479,024 | $294,369 | $184,655 |
| 2019 | $5,577 | $469,633 | $288,598 | $181,035 |
| 2018 | $5,430 | $460,426 | $282,940 | $177,486 |
| 2017 | $5,353 | $451,399 | $277,393 | $174,006 |
| 2016 | $5,240 | $442,549 | $271,954 | $170,595 |
| 2015 | $5,162 | $435,902 | $267,869 | $168,033 |
| 2014 | $5,021 | $427,364 | $262,622 | $164,742 |
Source: Public Records
Map
Nearby Homes
- 1720 E Socap Walk
- 1716 E Socap Walk
- 1722 E Socap Walk
- 1719 E Socap Walk
- 1717 E Socap Walk
- 1719 W Socap Walk
- 1721 W Socap Walk
- 1721 E Socap Walk
- 1717 W Socap Walk Unit WK
- 1724 E Socap Walk
- 1723 E Socap Walk
- 1723 W Socap Walk
- 1725 W Socap Walk
- 1725 E Socap Walk
- 1726 E Socap Walk
- 1716 7th St
- 1718 7th St
- 1727 E Socap Walk
- 1727 W Socap Walk
- 1720 7th St